Spot the problem quick — why operators get stuck
Right, listen: bus ops managers keep bleedin’ spreadsheets full of hoped-for savings and no clear proof. You want fewer claims, less downtime and calmer drivers, but you end up squinting at numbers. That’s where proper bus fleet management bus fleet management ties into the mess — it collects the hard facts so you ain’t guessing. I’ve sat with ops leads who’ve run routes in London under Transport for London (TfL) operations and watched them balk at vague vendor promises; they needed measurable results, not waffle.
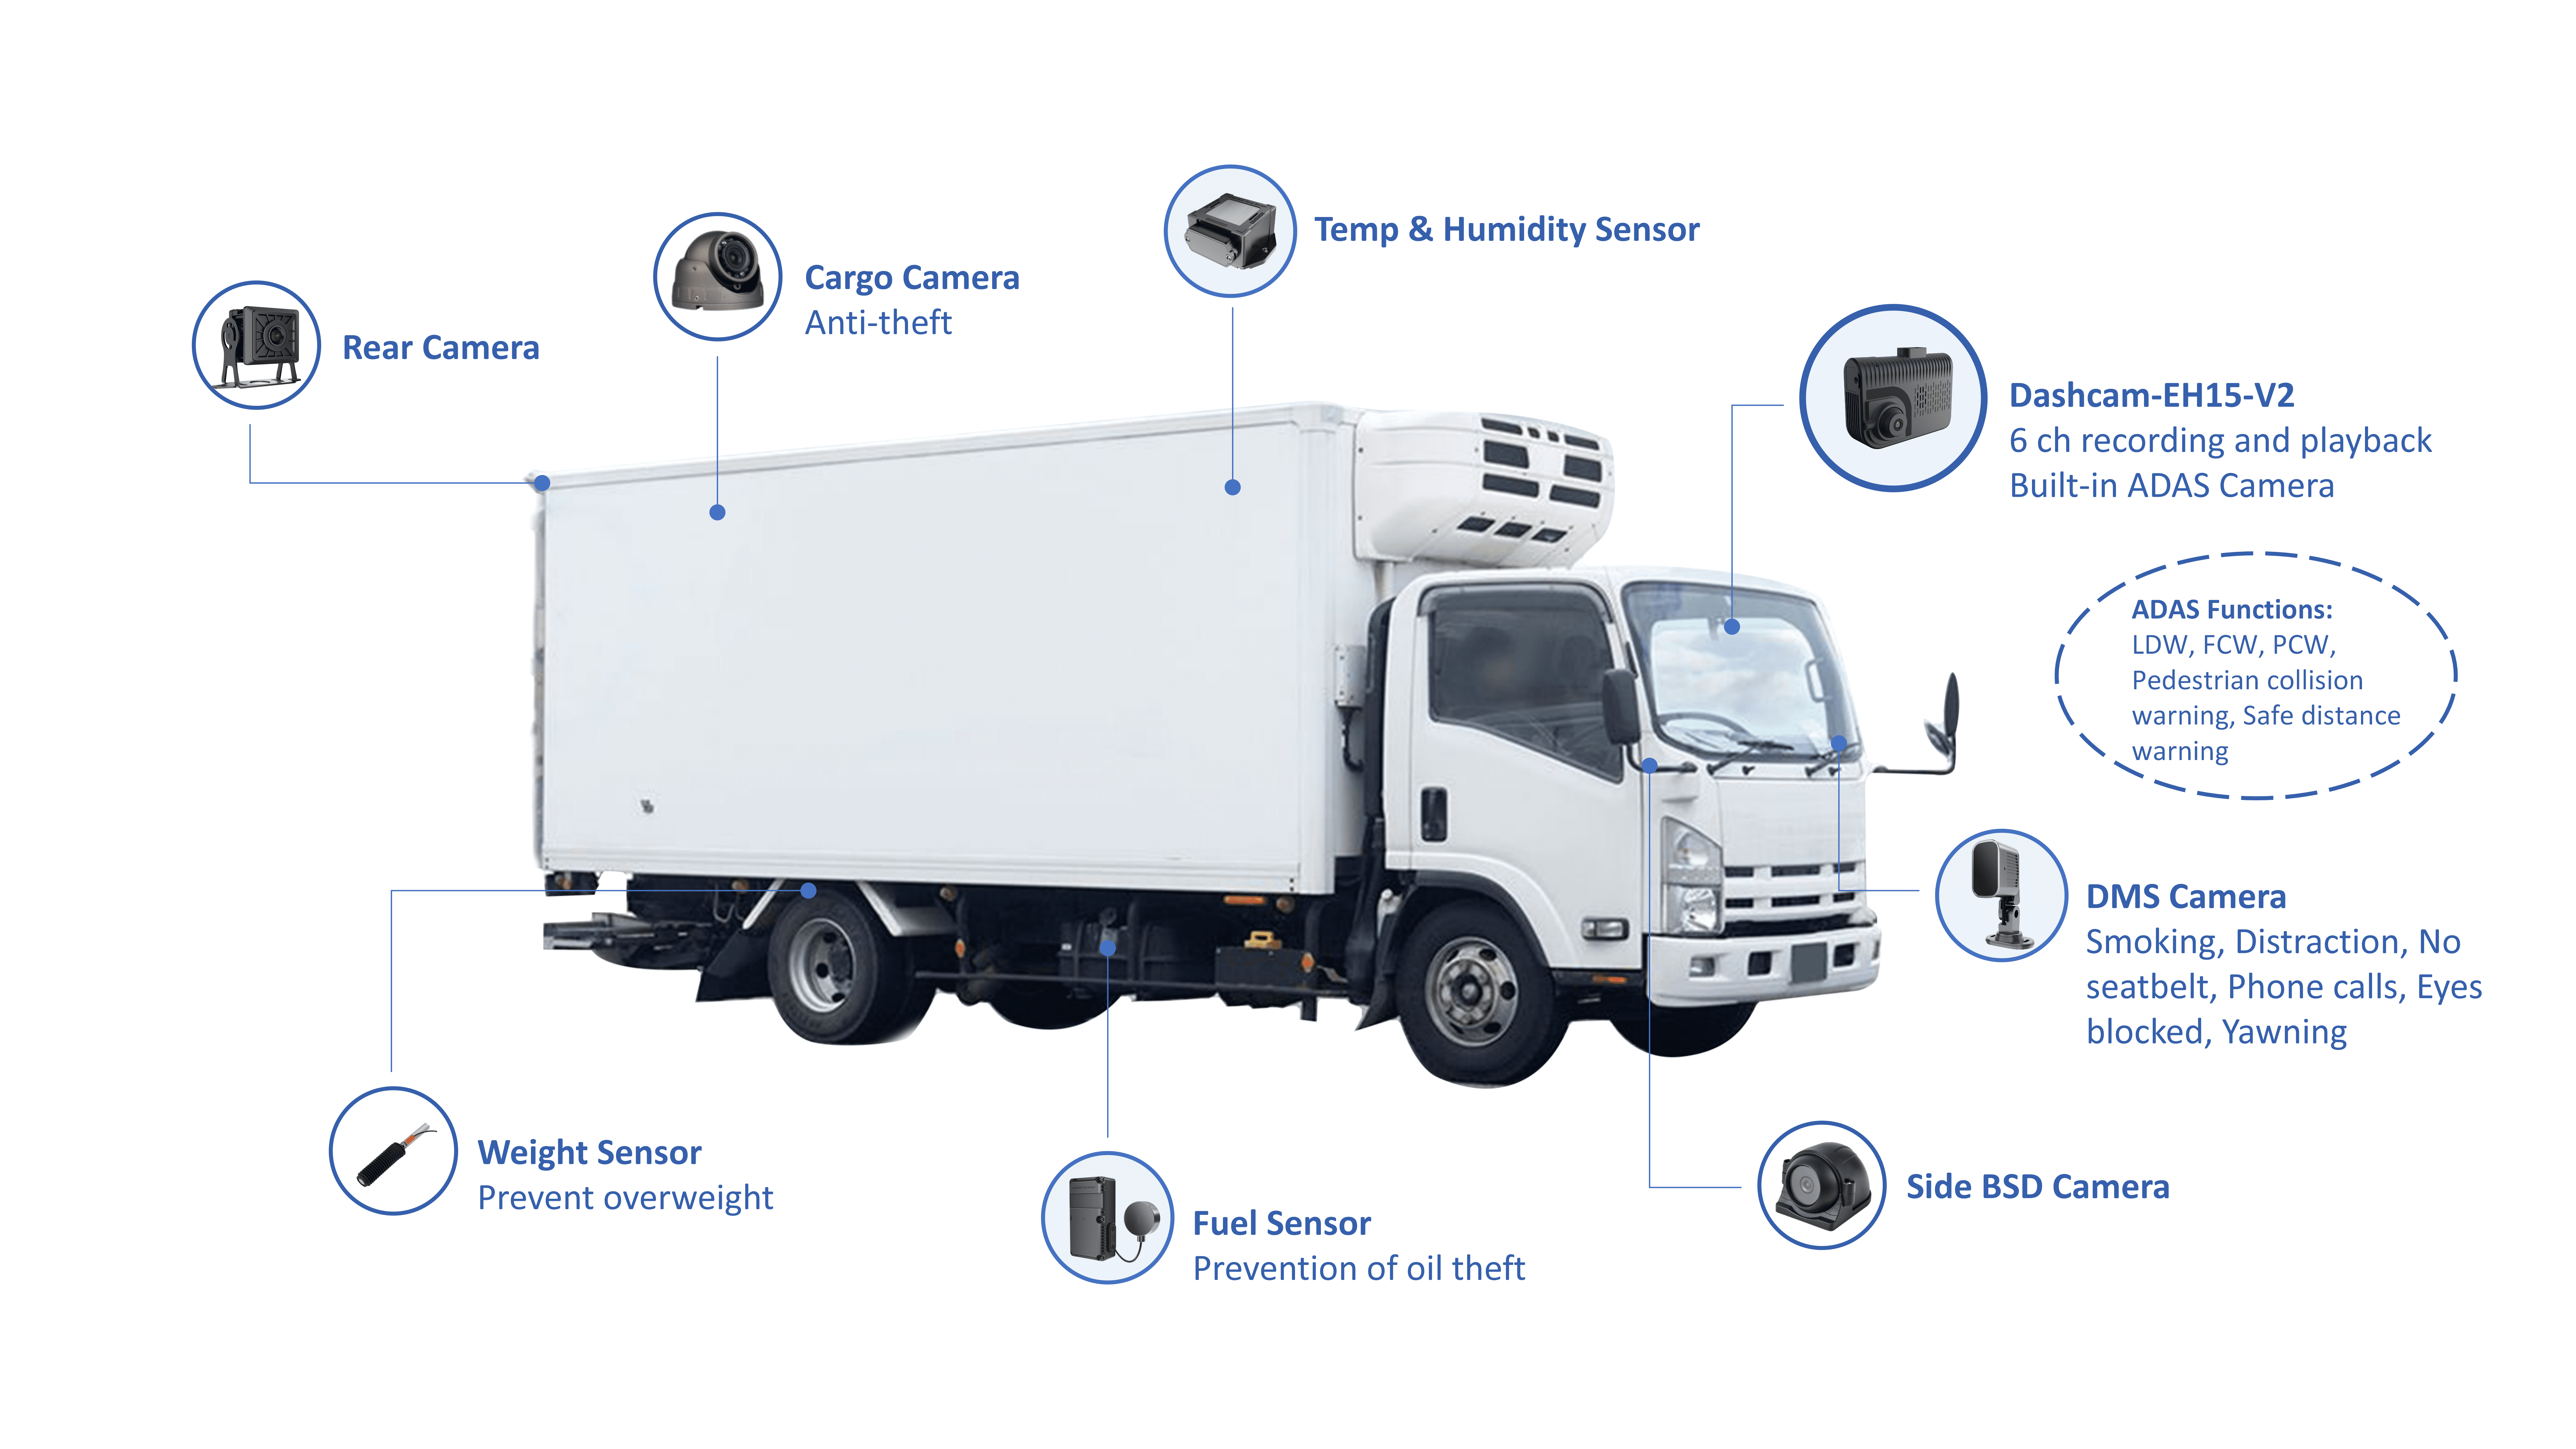
What a 3‑channel dashcam actually fixes
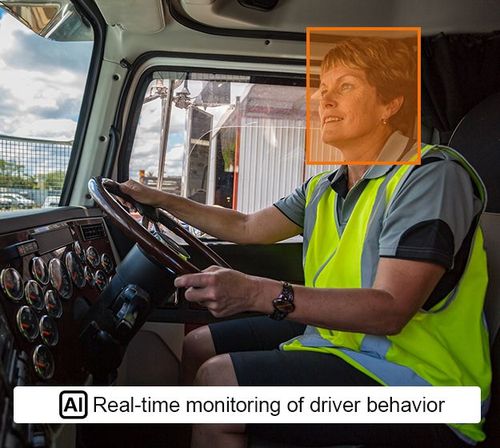
Problem first: crashes, false claims, and driver disputes. A three‑channel rig (forward, driver, rear) gives a fuller picture. That matters because:- forward footage clarifies fault and near-miss context;- driver view shows distraction or defensive actions;- rear view proves following distance and third‑party culpability.You get evidence that shortens investigations, reduces payouts and speeds return‑to‑service. No poetry: it replaces guesswork with footage.
Concrete metrics to use — don’t muddle ’em
Measure these, in order, and keep them simple:- baseline claims cost per month (cash outlays, deductibles, admin);- incident rate per 100,000 miles before vs after install;- average days a vehicle is off the road for incident repairs;- claims processing time (hours/days from incident to close);- driver‑related events flagged per 10,000 miles;- installation + recurring data costs vs annualised savings.Track each metric for a rolling 6–12 months. If a number moves, attribute it only after checking other changes — routes, staffing, or seasonal demand.
How to run a clean evaluation — step‑by‑step
Do this the right way:1) capture a 3–6 month baseline for the metrics above; 2) deploy cams on a statistically useful sample — not just the shiny buses; 3) run both groups in similar routes and times; 4) match incident reports to footage and log cost impacts; 5) normalise for variables like traffic or maintenance spikes; 6) calculate simple payback: (annualised net savings) ÷ (total installed + yearly fees).Keep notes on assumptions. If someone tells you the ROI is “immediate,” ask for the math.
Common mistakes that wreck the analysis
Watch out for these traps:- counting hypothesised savings instead of realised payouts avoided;- ignoring integration costs with your back‑office systems;- poor camera placement that misses critical angles;- data hoarding without processes to review footage quickly;- legal and privacy rules left unchecked — that costs fines and goodwill.Fix those and you’ll have numbers that actually mean something.
Comparing options — what to buy, and what to pair with it
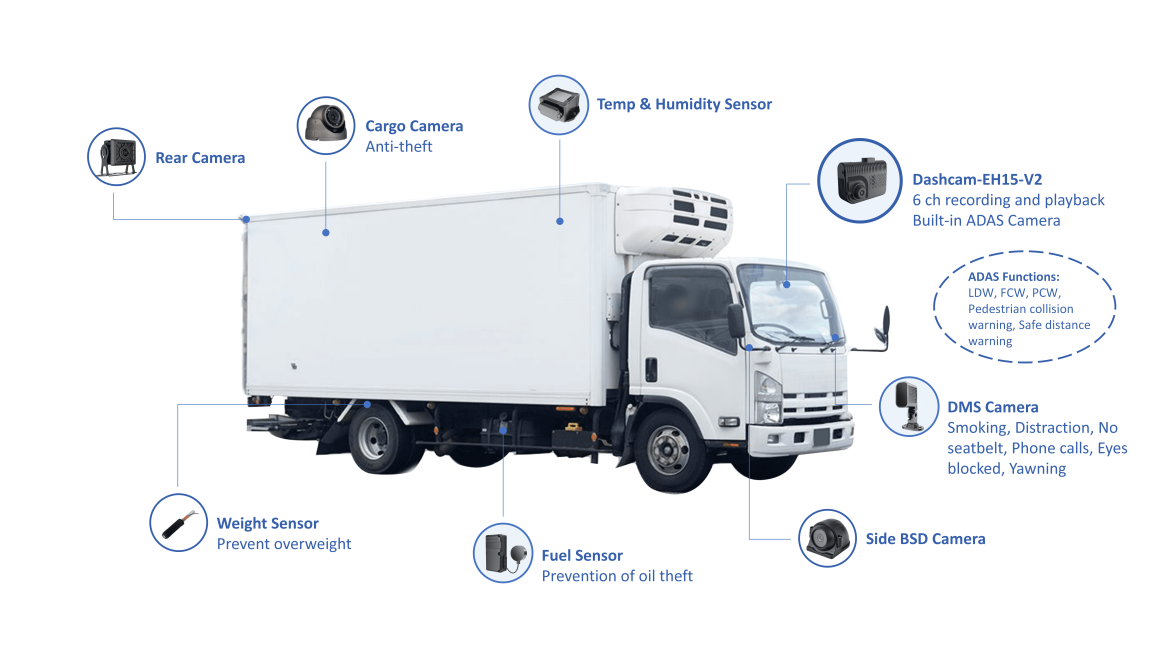
Don’t buy cameras in isolation. Consider:- single‑channel units: cheaper, but blind to driver or rear events;- cloud vs local storage: cloud simplifies access, local saves bandwidth but adds admin;- telematics-only: gives speed and harsh‑brake flags but no visual proof.If you already run a fleet platform, make sure the dashcam feeds into it. For example, pairing cams with bus fleet management software lets you cross‑check GPS, alarms and video quickly. That combo collapses investigation time and gives one source of truth.
A short, practical decision checklist
Ask these at your next ops meeting:- Are claims or downtime your biggest spend? Prioritise cams if yes. – Can you sample 10–20% of vehicles without disrupting service? If not, stagger rollout. – Do you have staff/processes to review clips within 48 hours? If not, budget for it. – Is your legal team on board with consent and retention policies? If not, freeze deployment.If you tick the right boxes, the tech pays back sooner than you think. If not, it’ll sit on a server and gather dust.
Final thought — how this all ties together
Look, it’s simple: start with the problem, measure what matters, avoid the usual cock‑ups and integrate the kit into your ops. The value shows up in fewer disputed claims, quicker fixes and clearer discipline — tangible savings a finance team understands. Operators who’ve done the maths pair the cameras with practical fleet tools; that’s where the pieces click together and the whole thing stops being a guessing game, like the measured solutions from BSJ.