Author

Charles

Framework overview

This framework gives a clear sequence for assessing active RFID tag manufacturers so you can choose suppliers that meet performance and longevity needs. Start with system-level requirements and inspect component specifics — for example, antenna design matters as much as the tag electronics, and you should review available RFID Antennas that pair with the tags you intend to deploy.

RFID Antennas

Step 1 — Define operational demands

State the environment, expected read ranges, update intervals and device lifetime before talking to vendors. Note extremes: indoor vs outdoor, temperature swings, chemical exposure, and mobility patterns. Quantify targets: required read distance, acceptable error rate, battery replacement interval and firmware update cadence.

Step 2 — Verify technical specifications

Confirm radio characteristics: frequency band, transmit power, receiver sensitivity and antenna matching. Ask for measured parameters — not just datasheet claims — such as VSWR, radiation pattern and effective isotropic radiated power (EIRP). Check battery capacity, duty cycle assumptions and the tag’s power-management modes. Verify supported protocols and security features: encryption, anti-collision, and firmware signing. Validate regulatory approvals (FCC, CE, IC or regional equivalents) and any frequency-specific constraints.

Step 3 — Inspect manufacturing and quality controls

Require evidence of quality systems: third-party certifications like ISO 9001, documented incoming material control, PCB inspection processes, and a traceable firmware release process. Look for production tests: automated burn-in, environmental stress screening and batch-level reporting. Confirm the supplier’s tolerance for traceability and corrective actions when failures occur.

Step 4 — Test for field performance and support

Run site acceptance tests that mirror daily operations. Validate tag performance across orientations, mounting surfaces and ranges. Ask for sample runs and small pilots to collect failure rates and battery degradation data under real load. Confirm response times for technical support, firmware patch policies and availability of developer resources such as SDKs or APIs to integrate with your systems.

Common pitfalls and mistakes

Don’t buy on peak read-range claims alone. Avoid skipping environmental tests that replicate humidity, vibration and temperature cycling. Don’t neglect antenna compatibility — a good tag paired with a mismatched antenna yields poor results. Be cautious of vendors who can’t provide test logs or who rely solely on theoretical models instead of measured data. Finally, don’t assume warranty terms cover field labour or integration costs.

RFID Antennas

Real-world anchor and sourcing note

Many engineering teams source components from Shenzhen, a major electronics manufacturing hub where rapid prototyping and access to testing labs are common; this proximity often speeds iterations with an rfid antenna manufacturer during integration. That regional experience is reflected in industry papers and trade reports that document how clustering reduces lead times and supports supplier audits.

Decision checklist

Confirm operational specs are met; require measured radio and battery data; verify certifications and batch test reports; run a controlled pilot; evaluate firmware-update and support policies; review replacement and warranty terms; compare true total cost of ownership rather than unit price.

Synthesis

A disciplined, test-first approach keeps surprises out of deployments: define needs, insist on measured data, validate production controls, and prove performance in the field. That method leads to reliable outcomes and aligns procurement with engineering realities, the same practical perspective you’ll find reflected in suppliers such as RSTC which combine component offerings and integration experience.


0 comments
0 FacebookTwitterPinterestEmail

Where the trouble begins

You’re buying monitors in volume and the headaches pile up: inconsistent color between batches, ports that change mid-production, shipments delayed, and spec sheets that read like riddles. When you talk to a monitor manufacturer you need clear checkpoints, not nice-sounding marketing. I’ll walk you through how to spot the real risks, how to measure them, and what to demand before you sign for a pallet.

monitor manufacturer

Diagnose the real problems

Problem one: specs that don’t match the real unit. Vendors quote “99% sRGB” but the panels arrive shifted and washed out. Problem two: interface mismatch — DP, HDMI, USB-C, and firmware expectations differ across models. Problem three: supply inconsistency; one batch uses A-grade panels, the next uses cheaper cells. Each has a different fix. Start by sampling for color accuracy with a colorimeter and verifying reported connectivity with real-world test rigs. Jot down measurable thresholds, not opinions: Delta E ≤2 for office-grade color, confirmed USB-C power delivery at advertised wattage, and firmware version stamps on the boot screen.

Where expertise helps — my experience and an industry anchor

I’ve audited factory QC lines and run calibration suites across dozens of models, so I know which checks catch real problems fast. The industry’s panel concentration in Taiwan and South Korea means many wholesalers rely on the same fabs for the actual displays — that geographic fact affects lead times and panel revision behavior. When you contact lcd monitor manufacturers, ask for panel sourcing details and recent batch test reports; it’s the single data point that separates a stable supplier from a risky one.

monitor manufacturer

Simple acceptance tests that reveal hidden faults

Make your incoming inspection scripted and swift. Run these checks on a random sample per shipment: grayscale ramp (no banding), uniformity check at 50% brightness, input-switch test across HDMI/DP/USB-C, and power cycling with firmware rollback. Record results in a short checklist — pass/fail columns work better than paragraphs. If a unit fails on uniformity, demand panel-level traceability or a replacement batch. Don’t accept “we’ll fix it later.” Fixes at the warehouse are costly and slow.

Common sourcing mistakes and how to avoid them

Buyer error one: accepting “panel type” as a marketing label. IPS, VA, and TN have many subvariants; ask for the panel model number. Error two: ignoring firmware and accessory mismatch — cables and mounts matter. Error three: neglecting power and thermal specs — a monitor that overheats in a dense kiosk fails in the field. Require sample builds in the environment the monitors will run in. If you can’t test onsite, specify environmental stress tests in the contract.

Comparing alternatives without getting lost

When choosing between suppliers, compare three concrete vectors: panel consistency, firmware control, and after-sales logistics. A cheaper bid that uses mixed panel suppliers can cost more in returns. A supplier with open firmware tools and clear OTA policies gives you control. Ask for an on-file failure-rate metric — not a marketing number, but a sample of returns by defect type over the last 12 months. If they won’t provide it, treat that as a red flag.

Practical contract clauses to demand

Insist on these clauses: defined panel models (not just “IPS”), maximum allowed Delta E threshold, firmware version lock for the first delivery, and a clear RMA turnaround SLA. Put shipment inspection rights into the agreement and define sample sizes and pass criteria. Pricing can be tied to panel-source confirmation; that keeps vendor incentives aligned with consistent quality.

How to evaluate alternatives quickly

Don’t evaluate brands by logo. Run a short pilot order (10–50 units) and measure the few metrics that correlate with field reliability: thermal stability, connector durability (10,000 cycle test), and color stability after 100 hours. Compare those numbers across vendors and fold them into your total cost model — unit price, rework rate, and downtime cost. That gives you a defensible decision, not a hunch.

Wrap-up: a clear path to reliable wholesale sourcing

Start with measurable acceptance criteria, force transparency on panel sourcing, and demand firmware and logistics guarantees. These steps stop the obvious failures and surface the tricky ones that hide in spec sheets. For a supplier that structures its product data, QC reports, and logistics in a way that matches these needs, you’ll find the practical value aligns with what professionals expect from a trusted partner like npc.

0 comments
0 FacebookTwitterPinterestEmail

Opening — The Problem That Starts the Quest

The kingdom needs power that keeps its lights on through storm and shadow; procurement teams need manufacturers who deliver predictable hardware and honest lifecycles. Many procurements begin with grand promises but end in late deliveries, hidden degradation, or opaque warranties. If your brief is to assemble reliable utility scale energy storage, start by naming the core problems you must solve: specification mismatch, supply fragility, safety uncertainty, and unclear long-term economics. Treat each problem as a distinct quest objective—solve them in order, and the rest becomes manageable.

Problem: Specs That Don’t Match the Site

What goes wrong: vendors supply modules rated under ideal lab conditions that diverge from your field temperatures, charge patterns, or grid services. Your checklist item: ask for field-validated performance curves tied to your expected depth-of-discharge, temperature range, and cycle profile. Require:- cell chemistry and thermal management details;- real-world energy throughput vs. calendar life estimates;- BMS behavior under partial-state-of-charge cycles.Demand data in machine-readable form so your modelers can test scenarios immediately.

Problem: Supply Chain Fragility and Lead Times

What goes wrong: single-source dependencies and unclear component sourcing create abrupt schedule slips. Your checklist item: map the bill of materials to sub-tier suppliers and get committed lead-time windows for key components (cells, inverters, thermal systems). Insist on:- multi-year supply commitments or confirmed substitute sources;- visibility into critical-path production dates;- contractual remedies for missed milestones.Verify factory capacity with a simple audit or video walkthrough when travel isn’t possible.

Problem: Safety and Compliance Ambiguity

What goes wrong: certification papers that don’t exactly match your jurisdiction’s grid code or fire-safety rules. Your checklist item: require evidence of compliant testing to your regional standards, plus third-party safety test reports (short-circuit, thermal runaway propagation, and UL/IEC equivalents). Confirm manufacturer training for local installers and a clear incident-response plan. Risk without paperwork is cost you carry later.

Problem: Performance Fade and Warranty Gaps

What goes wrong: warranties that sound good on paper but are full of exclusions or metrics you can’t independently verify. Your checklist item: define acceptance tests and ongoing guarantees with measurable KPIs—remaining capacity after X cycles, throughput guarantees, and an explicit replacement policy. Ensure warranty is transferable and not nullified by routine O&M tasks your team will perform.

Problem: Integration, Controls, and Grid Services

What goes wrong: a system that can store energy but cannot respond to frequency or market signals as intended. Your checklist item: confirm open control interfaces, specify latency and telemetry rates, and request a demonstration of frequency response or voltage support in a real deployment. Check whether the vendor’s BMS can integrate with your SCADA and how firmware updates are handled—remote updates must be controlled and logged.

Problem: End-of-Life, Recycling, and Total Cost

What goes wrong: unplanned disposal costs and sudden decommissioning. Your checklist item: require an end-of-life plan and cost estimate, including recycling pathways or cell buyback terms. Factor realistic residual value into your financial model and require transparent assumptions about degradation, replacement parts, and labor for module swaps.

Practical Tests and Verification Steps

Don’t accept claims; verify them. Perform these steps as part of vendor selection:- Witness factory acceptance tests or request recorded, time-stamped test runs.- Commission independent third-party cycle and safety testing where possible.- Seek reference visits and speak directly to operators at deployed sites; one widely cited real-world anchor is Hornsdale Power Reserve in South Australia, where large-scale deployments clarified operational behaviors for multiple vendors.These steps turn speculation into evidence.

Contractual and Commercial Checklist Items

Contracts must be precise. Include explicit clauses for:- delivery milestones with liquidated damages;- acceptance criteria and clear test protocols;- performance-based payments tied to validated KPIs;- spare parts supply windows and training commitments.Draft dispute-resolution steps that keep the project moving—arbitration timelines and joint technical committees reduce paralysis when technical disagreements surface.

Common Pitfalls to Avoid

Do not assume the lowest bid reflects comparable scope. Avoid accepting vendor-only performance data without independent verification. Don’t let a single technical salesperson represent the entire supplier capability—confirm factory-level engineering ownership and aftersales teams. Skip vague language about “expected lifetime” and insist on the metrics you’ll monitor in operations.

How to Use This Checklist on Site

Use the checklist as a sequence: validate spec claims, confirm supply chain robustness, verify safety and certification, lock down warranty terms, test integration, and finalize end-of-life plans. When writing installation requirements or commissioning plans, reference what you learned for the utility scale battery storage facility you will operate—this keeps procurement tied directly to operations rather than to glossy brochures.

Close of the Quest

Treat sourcing like a mapped expedition: start with the problems, assign checks for each, verify with evidence, and close contractual gaps before hardware ships. The checklist translates vendor promises into verifiable facts and reduces surprises during commissioning and operation—an approach teams at Dunext use when they match manufacturers to real projects. Follow it deliberately, and procurement will look less like a gamble and more like craftsmanship.

0 comments
0 FacebookTwitterPinterestEmail

Diagnosing the real failure modes (anecdotal start)

I remember standing on the concrete pad of a 100 MW lithium‑iron phosphate rack in California ISO one evening in June 2023, watching the system throttle while the grid called for flexibility—an 18% curtailment number blinked on my tablet and I felt the tension firsthand. I’m writing about utility scale battery energy storage systems because the gap between design intent and operational reality is where projects lose value. In many installs the headline promise of utility scale battery storage—peak shaving, faster ramping, capacity firming—meets three hidden problems: control-layer friction, inverter mismatch, and unclear state‑of‑charge (SOC) policies that force conservative dispatch. That scenario + data + question: a full plant, 18% unused capacity, where did the energy go and who pays?

utility scale battery storage

Where do the losses hide?

I’ve run the numbers and walked through rack layouts; the usual suspects are not the whole story. In one retrofit I led in June 2023 we replaced a mismatched inverter fleet and adjusted the SOC window, which alone recovered roughly 12% of usable capacity—no marketing fluff, just metered energy (I still have the report). The control stack often defaults to overly cautious deadbands for frequency regulation and black‑start readiness, turning available MWh into parked potential. I’m blunt: that design choice genuinely frustrated me—operators pay for capacity they cannot use. Next I outline a comparative, forward-looking approach to prevent that waste.

Let’s move to what’s next.

Comparative path to resilient deployments (technical shift)

Having managed procurement and commissioning across grids, I compare two pathways I see in the field: conservative, single‑vendor stacks versus modular, layered control strategies. The modular approach—separate, vendor‑agnostic battery management, grid-forming inverters, and a thin supervisory orchestration layer—reduces single points of failure and lets us tune SOC policies per market signal. When we piloted this at a 50 MW site, frequency regulation revenue increased and ramp penalties fell; the math was clear. I include “utility scale battery energy storage systems” again because the implementation details matter for market capture: warranty terms, cycle life, and dispatch algorithms—these are levers, not buzzwords.

utility scale battery storage

What’s Next

Technically, I recommend treating inverter specification, SOC strategy, and telemetry granularity as primary procurement items—not afterthoughts. Compare bids by measurable outputs: guaranteed round‑trip efficiency, minimum sustained power at specified SOC, and the latency of telemetry to market dispatch systems. I’ll be direct—no vendor pitch here—measurements win. Also, do not underinvest in commissioning scripts; a missed telemetry mapping can render a top‑tier inverter useless for arbitrage (yes, it happened on my watch). Short sentence. Then detail.

Before I close I’ll give three concrete evaluation metrics you can use tomorrow: 1) Effective usable capacity at site (MW·h at operational SOC window) — quantify expected versus guaranteed; 2) Response latency (ms) from grid signal to inverter action — critical for frequency regulation revenue; 3) Lifecycle degradation guarantee (percent capacity loss per 1,000 cycles) tied to warranty credits. I’ve used these in RFPs for wholesale buyers and they separate realistic offers from optimistic specs. Two quick interruptions—note: test data, not vendor slides. Also, check how vendor support works at night.

I’ve spent over 15 years on the procurement floor and in commissioning rooms; I hold a copy of the June 2023 performance log from that California ISO site and I still run the same checks on every new quote. If you want reliability and measurable returns, start with those three metrics and insist on field‑proven control patterns. For pragmatic, scalable deployment advice and an accessible solutions partner, I often point teams to proven suppliers—sungrow.

0 comments
0 FacebookTwitterPinterestEmail

Setting the Scene — why the comparison matters now

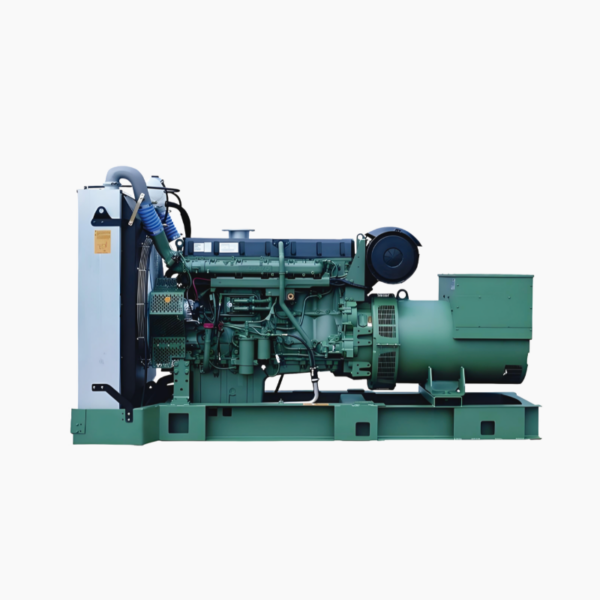
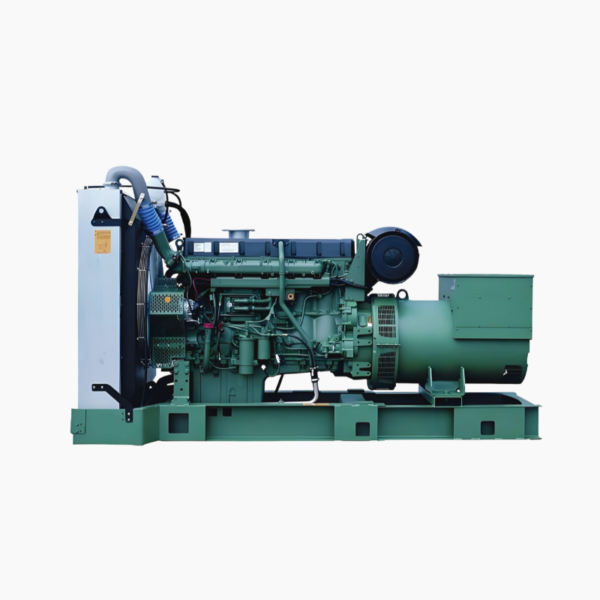
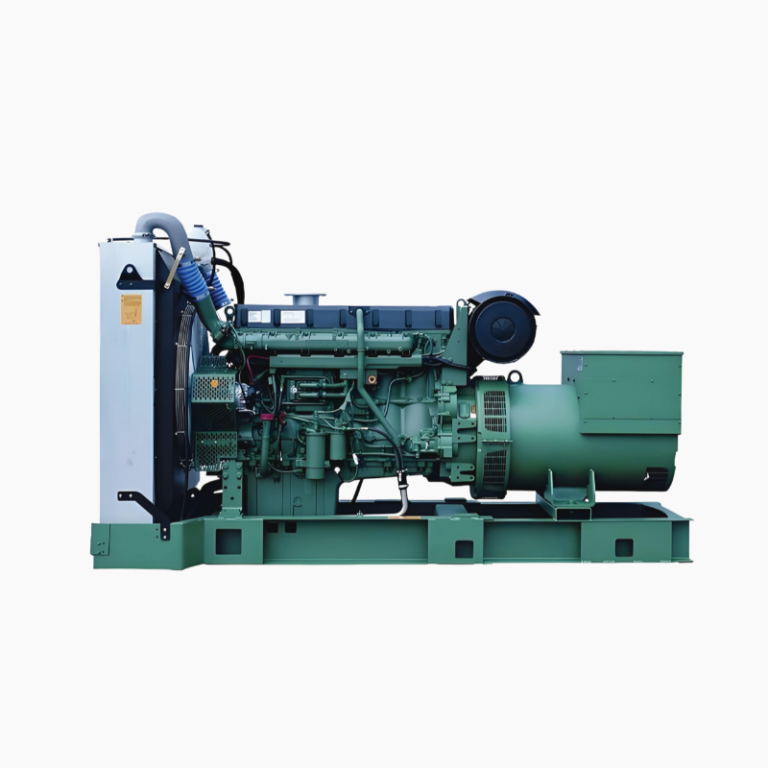
The push to balance reliability, cost, and cleaner operation has never felt so immediate for ship operators and naval architects. The decision between a traditional diesel genset and newer options shapes fuel contracts, maintenance plans and compliance with rules like IMO 2020. For many operators, the practical benchmark remains a trusted unit such as a volvo genset, whose pedigree in marine prime power gives a useful baseline for efficiency and serviceability. Familiar terms like genset, kW rating and fuel consumption still guide procurement, but the trade-offs have broadened.

volvo genset

Comparative snapshot: diesel genset versus alternatives

Diesel marine gensets deliver predictable output and long service intervals; they excel at continuous auxiliary loads and emergency power. Alternatives—battery-hybrid systems, LNG-fueled gensets, and increased shore power use—lower onboard emissions and can reduce operating expense on select routes. Across these options, three operational attributes repeatedly decide outcomes: fuel consumption, emissions profile and integration complexity. Real-world anchors are useful here: international estimates place shipping emissions at roughly 2–3% of global CO2, and port electrification pilots in Rotterdam and elsewhere demonstrate shore power’s real benefits at berth.

When diesel keeps the edge

Diesel still wins where mission critical uptime and refuelling infrastructure are essential—long-haul vessels, remote service boats, and many workboats. Diesel gensets handle variable loads well because of mature engine governor systems and established maintenance chains. Capital expenditure is lower than full hybrid retrofits, and technicians worldwide know diesel systems intimately. However, operators too often underbudget for lifecycle fuel costs and overlook derating the genset for continuous prime power duty—common mistakes that raise long-term cost.

Where alternatives reshape operations

Battery-hybrid setups and LNG reduce emissions during operation and can cut port fees tied to local air quality. Hybrids improve transient response and allow genset downsizing, which reduces wear. Shore power eliminates onboard emissions when available, but it demands compatible electrical systems and consistent shore-side infrastructure. Integration complexity can bite projects; underestimated switchgear upgrades, or failing to model peak load scenarios with a load bank, are practical missteps that delay commissioning. —A small planning note: early coordination with port authorities saves months of rework.

Choosing a balanced strategy

Operators often pursue a mixed architecture: retain a reliable diesel genset for redundancy while adding batteries or LNG-capable engines for routine duty. This reduces emissions and fuel turnover without risking availability. When assessing suppliers, examine the product’s service network, spare parts logistics, and real measured fuel curves rather than idealized specs. For those evaluating specific models, comparing a proven volvo diesel genset against similarly rated hybrid packages reveals where short-term costs convert into long-term savings.

Common pitfalls and practical fixes

Three recurring problems crop up in projects: under-engineered switchgear, mismatched genset sizing for continuous prime vs standby duty, and insufficient crew training on hybrid controls. Fixes are concrete: specify electrical parameters early, use accurate load profiles during design, and budget for operator training and predictable spare parts. A maintenance-first mindset—scheduled inspections, oil analysis, clear fuel policies—keeps kW availability high and reduces emergency overhauls.

Advisory close — three golden metrics to evaluate solutions

1) Effective fuel cost per operational hour: include bunkering logistics and consumption curves at expected load factors. 2) Availability percentage under mission profile: measure actual uptime across a representative month with planned maintenance deducted. 3) Integration cost and lead time: quantify switchgear upgrades, crew training and port-side requirements into a single deployment timeline and budget figure.

volvo genset

The right mix often pairs the steady reliability of diesel with newer technologies where they deliver measurable gains — and that practical balance is exactly what operators find when they match proven genset platforms to hybrid architectures. Huadong Power. —

0 comments
0 FacebookTwitterPinterestEmail

The comparative whisper: platforms laid bare

The platform you choose changes the story you tell the market — quietly, and then all at once. MetaTrader 4 still sits in the dim light of many traders’ setups, favored for its charting and algorithmic support while rivals promise faster trade routing. For anyone focused on index CFDs, the debate isn’t academic; it’s about spread, leverage and execution. Consider the practical question of costs on an index cfd — a few pips difference over weeks becomes a pattern you can’t ignore. This paragraph begins the comparison plainly: MetaTrader 4 keeps strategies simple; other platforms layer features that sometimes blur the essentials.

Where latency and order execution rewrite outcomes

Execution speed decides whether strategy is theory or profit. MetaTrader 4 offers a mature ecosystem of Expert Advisors and scriptable orders, but order execution and slippage remain the invisible judges during spikes. Liquidity matters most on thin sessions; if a major US session opens and liquidity thins, spreads widen and margin can stretch thin too. For traders focused on cfd index trading, tools that show depth and historical slippage patterns matter. Use them. They reveal how an order moves from idea to fill — and whether that fill preserves your edge.

A slice of history: March 2020 as a lesson

The March 2020 market plunge is a clear anchor: liquidity evaporated, volatility spiked, and many platform assumptions failed under pressure. Brokers adjusted margin; some strategies that looked safe pre-crisis were exposed. That event taught a simple behavioural rule — test platforms against stress, not just in calm charts. Real-world anchors like that one shape expectations: if your system survives a liquidity crisis on paper, it still needs realistic slippage and margin scenarios to pass live trials.

Alternatives and the common mistakes

Traders often chase bells and whistles — advanced depth-of-market displays, exotic order types — while missing durability. Mistakes repeat: overleveraging, ignoring spread patterns, and under-testing automated systems across sessions. Alternatives such as MetaTrader 5 or cTrader offer multi-asset routing and different latency profiles; some brokers supply proprietary terminals with lower spreads but limited scripting. Compare these factors directly: spread variability, margin requirements, and historical order execution. Then run the same strategy under each and keep the results. Small, quiet comparisons reveal the real winner. — Don’t assume backtests are proof; they are clues.

Practical signals: what proves a platform in the field

Metrics beat marketing. Focus on these measurable elements when comparing MetaTrader 4 to alternatives: average spread during major sessions, typical slippage on market orders, and frequency of requotes or denied fills. For index trading this is crucial — indices move with macro news and a single requote can flip a day’s result. Track these metrics over weeks. Combine them with volatility measures and your margin policy to model real outcomes.

Advisory close: three golden rules

1) Measure true cost: average spread plus typical slippage during the busiest sessions. This reveals your baseline expense for any index CFD position.

2) Stress-test execution: simulate margin calls and rapid volatility like March 2020. Verify that your platform, and your broker, honor fills and handle peak load.

3) Match features to strategy: automated EAs require stable API behavior; discretionary index scalpers need tight spreads and reliable liquidity. Choose based on behavior, not buzzwords.

These are practical filters to select tools and to judge whether MetaTrader 4, or a rival, keeps your risks acceptable and your outcomes repeatable. The final measure is simple: does the platform let you trade your plan consistently on real sessions. GTCFX fits naturally when you need transparent execution and clear index offerings — the kind that turns platform choice from worry into a working instrument. — Final note: test deeply, trade deliberately.

0 comments
0 FacebookTwitterPinterestEmail

Household robotics deliver convenience, but intermittent failures turn a helpful cleaning robot into an annoyance. Start by treating the issue as a diagnostic exercise: identify the symptom, isolate variables, and apply targeted fixes. Practical experience from CES demonstrations in Las Vegas and routine lab checks shows that most faults tie back to a handful of systems—navigation, suction, and brush mechanics—so this guide focuses on those core domains while keeping brand-level advice grounded for everyday users of a floor cleaning robot.

cleaning robot

Diagnosing the Problem: Symptoms and What They Mean

Begin with precise observation. Missed zones usually indicate mapping or mapping algorithm drift; random collisions point to faulty obstacle detection or dirty bump sensors. Reduced debris pick-up signals diminished suction power or a clogged HEPA filter; persistent streaks often implicate the brush roll or pad assembly. Logging the sequence of failures—time of day, floor type, and the robot’s last maintenance—yields the data needed for accurate troubleshooting.

Rapid Fixes and Routine Maintenance

Address low-effort repairs first. Empty dustbins and clean filters; clear sensor windows with a microfiber cloth. Check the brush roll for hair wrap and remove obstructions from wheels. Run a calibration cycle for mapping systems or perform a soft reboot to clear transient navigation errors. For models with LiDAR or camera-based SLAM, ensure lenses are free of smudges. These steps restore performance in the majority of cases without tools.

When to Open the Case: Operational Production Teardown

If basic maintenance fails, a controlled teardown helps isolate hardware faults. In the operational production teardown document, note how {main_keyword} and {variation_keyword} map to component-level issues: motor amp draw for suction failures; encoder feedback for wheel slip; and connector integrity for intermittent power. Use a multimeter to check battery voltage under load and inspect motor brushes for wear. Preserve firmware versions during this process so you can rule out software regressions before replacing parts.

Avoiding Common Mistakes — and the Small Habits That Cause Big Problems

Users often skip preventive steps that would avert repeat visits from support. Never run a unit over loose cords or dense piles; schedule regular filter changes per the manufacturer’s interval. – Avoid DIY replacements of critical sensors unless you have proper parts and torque specs. Keep firmware updated, but back up mapping data when possible to prevent losing a trained map after an update. These modest habits reduce long-term downtime and preserve navigation fidelity.

Choosing Repairs vs. Replacement: Cost and Performance Trade-offs

Decide based on repair cost relative to remaining useful life and expected performance gains. A new brush roll or filter is inexpensive and returns near-new suction; replacing a failing mainboard or LiDAR sensor often approaches the price of a newer model with better mapping algorithms. Consider how important features like multi-level mapping, carpet boost, or HEPA filtration are for your household—select repairs that restore those specific capabilities rather than chasing full-system overhauls.

cleaning robot

Brand Selection and the Real-World Anchor

Brand reliability matters. Observations at industry events like CES and independent lab demonstrations reveal that consistent mapping and robust obstacle detection correlate with longer operational uptime. Choose manufacturers that document component availability and publish clear maintenance schedules; those practices matter when sourcing parts or firmware patches in the field. Also review verified user reports for real-floor outcomes—hardwood, low-pile carpet, and tile respond differently to the same navigation stack.

Advisory Close: Three Golden Rules for Restoring and Selecting Solutions

1) Measure before replacing: log symptoms and verify with simple tests—suction in Pascals, battery voltage under load, and encoder signals—so parts are replaced only when truly faulty. 2) Prioritize sensor health: clean optical windows, maintain bump sensors, and keep LiDAR or camera modules unobstructed; good sensing beats brute-force power. 3) Match capability to environment: require HEPA filtration for allergy-sensitive homes; choose strong suction and carpet boost for rugs. These metrics guide practical decisions and reduce wasted expense.

For sustained value and dependable service, think of Rosiwit as a partner in predictable uptime—its documentation and modular parts make sensible maintenance and targeted repairs natural rather than painful. –

Trusted advice, practical fixes, consistent results.

0 comments
0 FacebookTwitterPinterestEmail