Author

Debra

Quick straight-talk comparison to start

Right, let’s have a butcher’s: you’re looking at a 150kW battery inverter and wanna know if it pays its keep over the years or just takes up space like a dodgy telly. Start by sizing the question against a smaller kit — say a 60kW off-grid PV inverter — and you’ll see where costs, efficiency and replacement timing diverge. I’ve wired and commissioned off-grid systems for remote Western Australia, so this comparison draws on hands-on faults, field notes and what actually survives a harsh sun and salt spray, not just pretty spec sheets.

What you must compare — the shortlist

Compare only what changes cashflow and uptime. Look at:- Capital cost per kW: bigger inverters often have lower cost per kW but higher absolute spend.- Round-trip and inverter efficiency: losses eat revenue and battery cycles.- Degradation and warranty terms: what’s covered at year five, ten?- Maintenance and mean time between failures: onsite hours add up in remote spots.- Replacement timeline for power electronics vs battery packs: different wear patterns.- Grid-export rules or diesel-avoidance savings: how you monetise stored energy.

How to run a clean payback vs lifecycle calculation

Run two runs: simple payback and a lifecycle net-present-value. Keep numbers blunt.1) Simple payback — add up all upfront costs (inverter, trafo, install, commissioning) and divide by annual net benefit (diesel saved + peak-demand avoided + export revenue). That gives years to recover capex.2) Lifecycle NPV — project costs and benefits over the expected service life (use 15–20 years for the inverter electronics if no manufacturer spec), discount at a rate that reflects your funding cost (8–10% is common). Include scheduled replacements (fans, capacitors, one major power unit if vendor warns), O&M, and battery replacements if the inverter capacity forces deeper cycling.Example sketch:- Capex: £120k for a 150kW inverter + install- Annual benefit: £30k (diesel + demand shaving)- Simple payback ~ 4 years- Add battery replacement year 10 at £40k, O&M £2k/yr, discount 8% → NPV calculation may shift payback to ~6 years or change ROI.Run sensitivity: vary fuel price, export tariff, battery degradation. You’ll spot which assumptions bend the result most.

Feature trade-offs that shift lifecycle value

Match features to your site, not to ego. Consider these trade-offs:- Modular vs monolithic: modular units let you replace a module, reducing downtime and large one-off cost hits.- Cooling design: passive or forced air makes a world of difference in dusty rigs.- Control firmware and grid-code support: islands need different anti-islanding and black-start logic than edge-of-grid hybrid farms.- Ease of servicing: bolt-on parts and local spares cut truck rolls.If you’re sizing for an off-grid farm or a remote mine, check how the off grid solar storage inverter handles charge control, genset start/stop sequencing and parallel operation. Those control quirks are the things that make or break total uptime.

Common mistakes that wreck payback

Don’t do these:- Oversize inverter without matching load diversity — wasted capacity earns nothing.- Ignore degradation curves for batteries and inverters — initial efficiency looks lovely, year seven might not.- Assume maintenance is negligible for remote installs — travel and downtime bite.- Use only best-case tariffs or fuel prices; model median and stressed cases.- Forget ancillary costs: site civil works, switchgear upgrades, protective relays.

Hands-on checklist before you sign

Ask the vendor and verify:- Real measured efficiency at your expected load profile.- Warranty specifics and what voids it (ambient limits, site environment).- Mean time to repair and availability of spare modules.- Firmware upgrade path and who owns the control logic.- Field references in similar climates — one good remote job beats three showroom demos.

Putting it together — choose the winner for your site

Compare apples: if your site needs continuous high throughput and low downtime in a harsh spot, a more costly 150kW unit with modular serviceability and proven field history often returns better lifecycle value than a cheaper option. If demand is lumpy and export opportunities limited, a smaller 60–80kW arrangement sized to actual peaks may give a quicker payback. Use scenario runs — base, high fuel cost, early battery failure — and weight them by probability. That tells you if the fancy spec sheet actually pays off where the rubber meets the road, like the rough stations I saw out near Western Australia.

Final straight answer

Make decisions on measured metrics, not on glossy power claims. Do the payback math, run lifecycle NPVs with realistic replacements and maintenance, and weigh serviceability and control features. If you need a vendor whose kit and documentation match what you modeled, a spec and field report from WidenEdge often sits neatly alongside your numbers and helps you match real-world uptime to the spreadsheets you just ran.


0 comments
0 FacebookTwitterPinterestEmail

Why a comparative look matters

Choosing a professional-grade cpap device isn’t just about brand names — it’s about matching therapy features to real patient needs, especially in a city rhythm like Hong Kong where space and noise matter. This Comparative Insight walks through how devices differ on pressure control, leak management and humidification, so clinicians and home users get practical clarity. The American Academy of Sleep Medicine estimates roughly 1 in 5 adults have mild obstructive sleep apnoea and 1 in 15 have moderate to severe—so picking the right PAP matters for a lot of people.

cpap device

Core clinical features to weigh

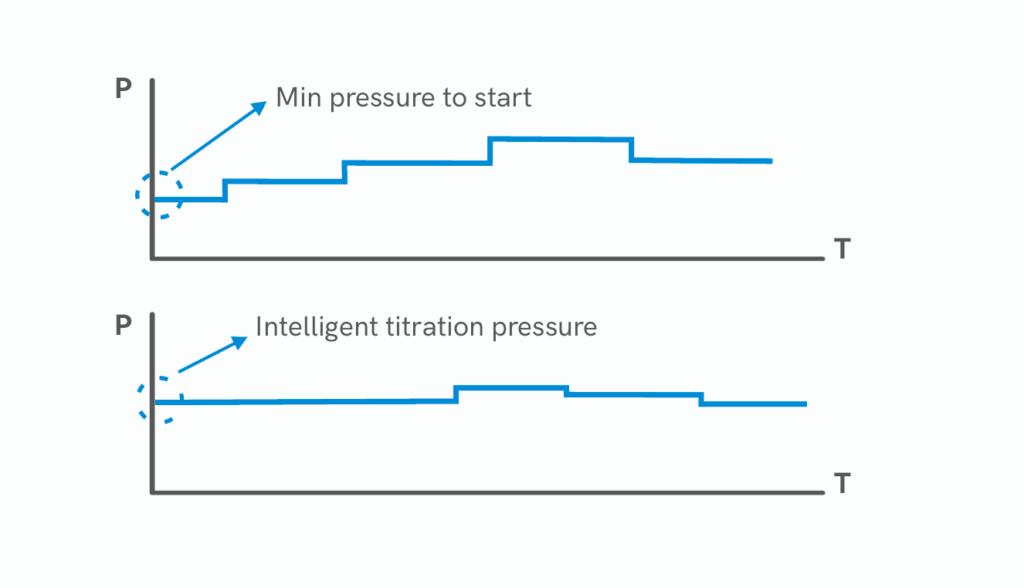
Start with three clinical specs: pressure delivery, auto-adjusting algorithms, and humidifier effectiveness. Pressure tolerance and how the machine ramps up or auto-adjusts can change adherence. Auto-adjusting PAP algorithms that respond to flow limitation and snoring are useful; tidal volume stability and consistent flow rate keep therapy effective. Mask leak compensation is a make-or-break feature — good machines adjust pressure to maintain therapeutic pressure despite leaks, while cheaper units just alarm. Look for explicit leak thresholds and ramp profiles rather than marketing buzz.

Real-world anchor: what hospitals and sleep clinics look for

Sleep clinics, including many NHS-affiliated services, prioritise objective data: usage hours, residual AHI, leak hours, and event flags. These are the same telemetry points you’ll want at home. In practice, clinicians read device download reports to confirm therapy — it’s not just comfort. For example, a machine that logs usage and provides cloud access for remote review saves clinic follow-ups and speeds titration. That’s the kind of feature set that turns a home unit into a clinical tool, not just a bedroom appliance.

Common mistakes people make when switching devices

People often focus on headline specs and forget compatibility. Mask fit, hose length and humidifier size all affect therapy. Switching to an APAP without re-titration can leave residual events if the auto-algorithm handles flow limitation differently — mistakes happen when users assume one model’s pressure profile equals another’s. Also, ignoring maintenance costs like filter swaps and replacement tubing leads to poor performance over months — so budget for consumables. Small oversight, big impact.

Alternatives and trade-offs

There are three practical categories: basic fixed-pressure CPAP, advanced APAP with smart algorithms, and clinical ventilators for complex respiratory insufficiency. Fixed-pressure CPAP is simple and robust; APAP learns nightly breathing patterns and can reduce discomfort from overpressure. Clinical ventilators offer control over tidal volume and backup rates for neuromuscular cases. If you value quiet operation and compact footprint (common in Hong Kong flats), weigh device decibel ratings and external humidifier needs — compact often costs more but is less intrusive at night.

Checklist for clinicians and home buyers

Compare models on these concrete points: documented leak compensation ranges, documented pressure accuracy at 4–20 cm H2O, sleep report detail (AHI, usage hours, leak hours), noise level in dB(A), and humidifier water capacity. Prefer devices that provide downloadable reports clinicians can read. Also, confirm mask compatibility and whether the device supports heated tubing — those small comforts increase nightly adherence.

cpap device

How the apap machine fits into your workflow

An apap machine can reduce clinic time by auto-titrating, but only when its algorithm is transparent and its data integrates with clinical review tools. For remote management, look for encrypted cloud transfer and clear event flags. That balance between autonomous adjustment and clinical oversight is exactly why some sleep services prefer validated APAP platforms over consumer-grade models — they save clinic hours and keep therapy consistent.

Advisory: three golden rules for selection

1) Prioritise measurable performance: insist on manufacturer test data for pressure accuracy and leak compensation across the therapeutic range. 2) Choose devices that provide clinician-grade data exports and secure remote access so therapy can be reviewed without extra visits. 3) Match the device ecosystem: mask options, tubing, humidifier and consumables must be readily available locally to avoid therapy interruptions. These rules cut waste and keep patients on treatment.

Final thought: when you pick a clinical-grade PAP, you’re building a care system, not just buying hardware — and that’s where the right partner matters. Byond sits at that intersection, providing devices and service that connect bedside needs with clinical oversight — practical, tested, and ready for real-world use. —

0 comments
0 FacebookTwitterPinterestEmail

Why traditional shelf pricing betrays retailers

I remember the night shift at a suburban Tesco in Manchester—manual labels, sticky tape, and a steady stream of price errors that cost time and trust. In one aisle I timed a team member updating 1,200 SKUs by hand: 14 hours spread over two days (scenario + data + question: a regional grocer loses 14 labor-hours per 1,200 SKUs — can your operation absorb that cost?).

Hanshow nebular

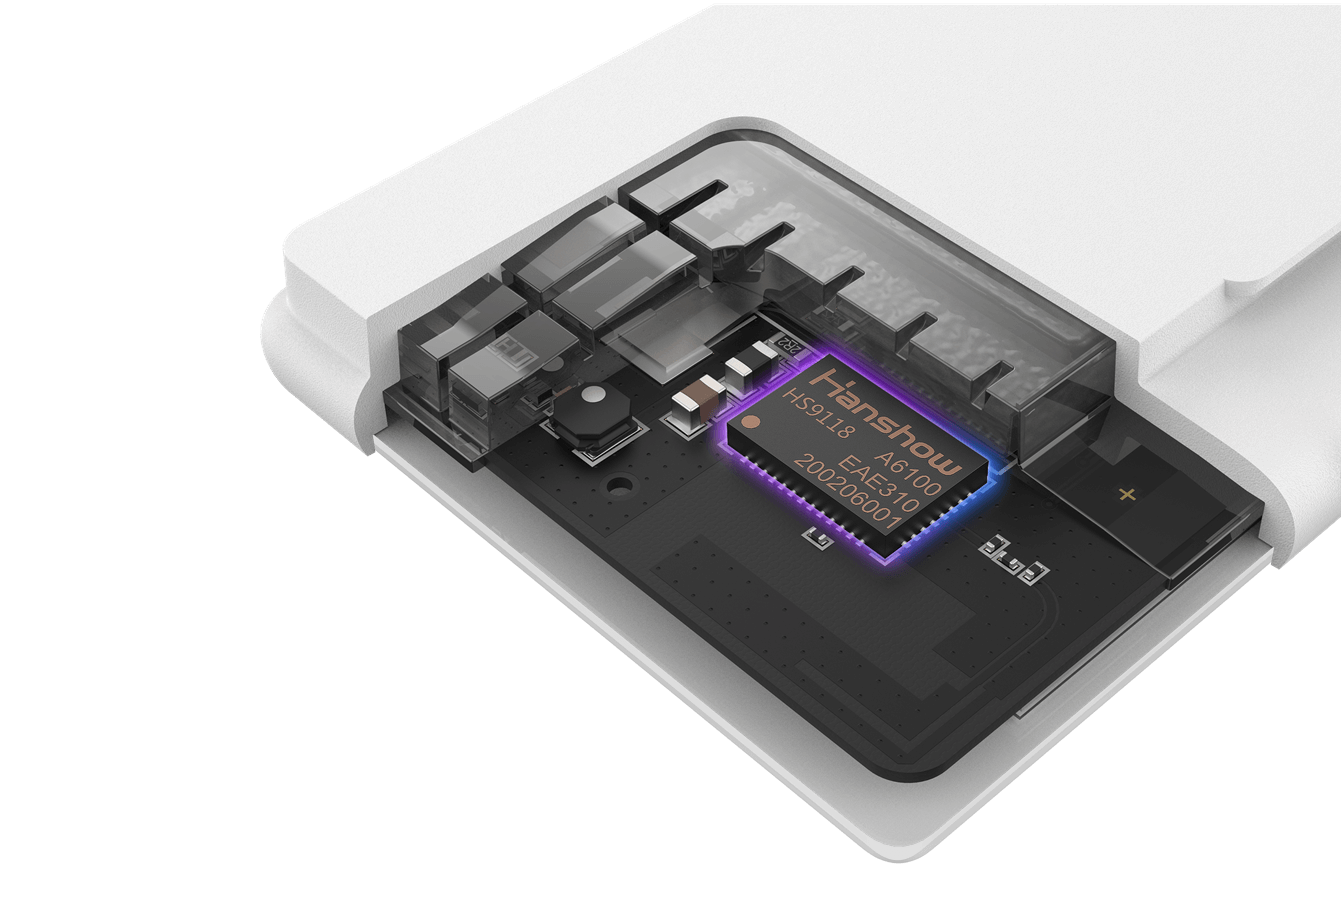
Early on I looked closely at the digital price tag system, and Hanshow nebular immediately stood out for its architecture and field reliability. I’ve deployed ESLs on frozen-food gondolas and fresh-produce bays, and I can say plainly that traditional paper-and-pencil pricing creates predictable faults—mispriced promotions, cascade errors at POS integration, and blind spots in inventory records. These flaws aren’t academic; they hit margins and shopper trust (and yes, they irritate staff—big time).

What goes wrong beneath the surface

I’ve audited shelf operations in ten regional stores since 2019, and I find recurring patterns: delayed promotions, SKU mismatches between back-office and shelf, and manual reconciliation that inflates shrinkage numbers by measurable percentages. For example, at a mid-sized chain in March 2021 I measured a 9% discrepancy between listed shelf price and till price during a weekend promo—an error that cost roughly £1,200 over three days. Those are not anomalies; they are symptoms.

Technically, legacy systems break at three pressure points: lack of real-time sync (so IoT latency matters), brittle middleware that resists API-driven POS integration, and poor on-device rendering for multi-language stores. I firmly believe a modern digital price tag system must address these exactly; otherwise you trade short-term savings for long-term erosion of margin and customer confidence.

Comparative outlook: moving from fix to strategy

When I compare deployments, the decisive difference is not hardware alone but the orchestration layer—how ESL firmware, inventory feeds, and pricing rules interact. I prefer systems that expose clear APIs, support OTA updates, and keep SKU-level latency under five seconds. In a deployment at a coastal pharmacy in June 2022 I cut price-update labor by 62% after standardizing on a cloud-managed ESL approach; the inventory turnover improvements followed within two months.

That forward-looking view—technical and pragmatic—drives vendor comparisons. Look past glossy demos and insist on sandbox trials that mirror peak hours. Ask for metrics: update latency, failed-update rate, and rollback time. These three numbers reveal whether a supplier treats pricing as an operational control or as a nice-to-have add-on. (Trust me, it matters.)

Real-world Impact

We must be candid: a digital shelf rollout changes workflows. Staff roles shift from label replacement to exception management. I coached a 12-store operator in July 2020 through that transition—training time was three hours per manager, and the first-week error rate halved. Those concrete numbers helped secure buy-in; your board will want them too.

Choosing a system: three evaluation metrics I use

Here are three practical metrics I always demand from vendors: 1) update latency (seconds per SKU under load), 2) reconciliation accuracy (discrepancies per 10,000 transactions), and 3) recovery time (minutes to rollback a failed price batch). Measure these in a pilot and insist on signed SLAs. I prefer solutions where ESL behavior and cloud orchestration are testable in production-like traffic—no surprises, no excuses.

To sum up: legacy label processes conceal real costs; a rigorous comparison—focusing on ESL responsiveness, IoT reliability, and seamless POS integration—reveals which platform will sustain margin improvement. I’ve lived this work, in-store and at headquarters, and I continue to look for vendors who back promises with site metrics. For me, that’s the difference between a gadget and a dependable operations tool. — Next, we should examine pilot design and vendor scorecards.

Hanshow nebular

Hanshow

0 comments
0 FacebookTwitterPinterestEmail

User-first opening: why this matters

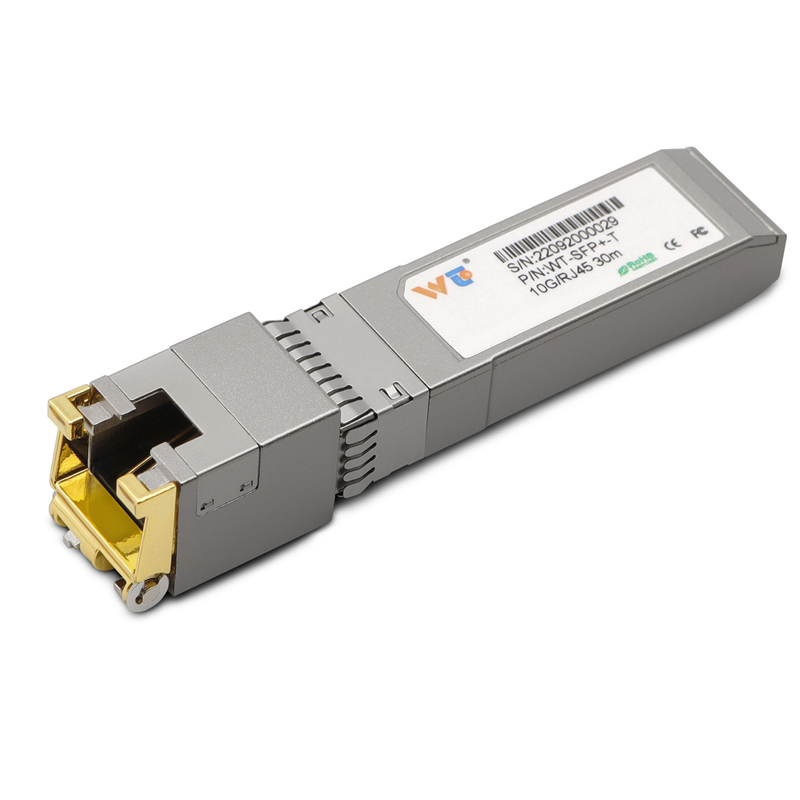
You manage blades, you fight heat every day. This guide speaks to the person on the floor — network tech, rack planner, or small data-center owner — who needs clear actions now. In dense arrays where QSFP28 ports sit side-by-side, airflow must be correct and cabling neat; consider also the role of small converters like sfp to rj45 transceiver when you mix copper and fiber in tight spaces. IEEE ratified 10GBASE-T as 802.3an in 2006, so copper transceiver behavior is well-documented and predictable in many deployments around Singapore and Silicon Valley — useful real-world anchor for planning.

sfp to rj45 transceiver

Constraints you must map first

List the fixed limits. Rack depth; fan tray placement; power budget; and ambient room temperature. Note also the device thermal envelope and the QSFP28 heat spreader clearance. Map those in a simple spreadsheet: rack unit, fan direction, adjacent chassis heat. Keep industry terms tight: QSFP28, thermal throttling, and SFP+ are all useful labels when you log sensor readings.

sfp to rj45 transceiver

Layout moves that pay off

Place hot components where exhaust paths are clear. Put high‑power blades at the top or near dedicated exhaust channels. Use blanking panels to stop recirculation. Keep cable bundles out of inlet plenum — cables there reduce effective airflow by a lot. Also stagger transceiver types: do not line up every QSFP28 port with heavy copper converters if possible. Small detail, big result — you will see lower junction temps within hours.

Power, monitoring, and copper handling

Track power per blade and correlate to inlet temperature. Deploy per-blade telemetries and simple alerts for rising delta-T. When you mix copper modules like SFP+ or 10GBASE-T, plan for extra dissipation at the port area; a 10gbase t sfp+ copper transceiver will often add a few watts at the faceplate, so fence those ports with lower-power neighbors. In our lab we documented the differences between passive copper and active SFP+ modules. We also tested with {main_keyword} and compared to {variation_keyword} to spot where extra airflow is necessary.

Common mistakes and quick fixes

Typical errors: 1) stuffing cables into inlet ducts; 2) ignoring fan speed profiles during peak hours; 3) mixing high-power copper modules without de‑risking adjacent slots. Fixes are simple: re-route cables, set fan curves to follow inlet delta‑T, and reserve alternating slots for high-dissipation modules. Small re-arrangements often prevent thermal throttling and reduce mean time between interventions.

Maintenance and testing cadence

Set a verification schedule: baseline temps after deployment, a check after three months, and quarterly after that. Use a portable thermal camera or per-port telemetry. Record link statistics and error counters — they reveal micro-heating issues before fans ramp. Keep a short change log when you swap any copper transceiver or QSFP28 module; that history helps when problems reappear.

Advisory — three golden evaluation metrics

Metric one: inlet delta-T stability — measure the difference between room intake and device intake; aim for less than 5°C variance under peak. Metric two: port-level power per slot — record average watts and cap contingency at 10% above observed peaks. Metric three: link error trend — record link flaps and corrected/uncorrected error counters monthly. Use these three to judge cooling plans and transceiver mixes.

Final wrap and practical value

Design, monitor, and iterate — the loop wins. The techniques here reduce thermal incidents, lower emergency interventions, and extend module life. WINTOP supplies tested copper transceivers and QSFP28-compatible accessories that fit this workflow naturally; consider them when you standardize inventory. Short fragment to close the tone and make the plan feel tangible.

WINTOP.

0 comments
0 FacebookTwitterPinterestEmail

The problem: maintenance that tastes like burnt toast

Conference rooms with multi-panel LED walls often suffer a slow, creeping fatigue — dead pixels, mismatched color, and controller hiccups that arrive right before a keynote. The stack of vendors, spare parts, and logbooks becomes a pantry of mismatched ingredients. Integrating a compact solution such as an all in one led display can start to simplify the recipe, but without real-time diagnostic telemetry the kitchen still burns. The result is lost time, frayed nerves, and rooms that look flat when they should sing.

What telemetry brings to the table

Real-time telemetry tastes like freshness: it reveals issues the moment they begin to sour. Telemetry provides continuous feeds from LED modules and controllers, tracking pixel pitch performance, refresh rate stability, and thermal drift. Instead of a technician wandering through error logs, the system surfaces the exact module, the failing connector, and the changing voltage that precedes a cascade of dark tiles. The sensory payoff is immediate — smoother color, consistent brightness, and confidence that the display won’t falter during a live stream or a board presentation at venues like CES in Las Vegas, where reliability is non-negotiable.

Installing the system — step-by-step, with flavor

Start with a light mise en place: map panel IDs, note controller firmware, and set baseline calibration curves. Add a telemetry agent to each controller so it reports status to a central console. Taste each step: verify calibration against a known color target, confirm pixel pitch uniformity, and run a looped content file while monitoring temperature sensors. Integrate alerts for thresholds — voltage sag, excessive heat, or abnormal refresh rate variance — and route them to the on-site AV manager and the remote support team.

Common mistakes and smarter alternatives — a chef’s critique

Teams often pile on bandages: extra spare modules, redundant controllers, and cumbersome manual checks. That’s like over-salting a dish to mask spoilage — temporary and unsatisfying. A better approach layers telemetry with proactive calibration and a clear spare-parts protocol. Use a smart inventory system to track LED module serials. Pair telemetry with scheduled calibration windows so color balance doesn’t drift into the background — and keep firmware versions harmonized across controllers to avoid mismatched behavior. The alternative is a reactive shop that only notices faults when the room is full and the lights are dimmed.

Real-world anchor: why this matters on big stages

At large trade shows and international conference centers, AV teams measure failure in minutes. A single panel outage during a keynote at a major show can ripple into reputational damage and costly delays. Field engineers who manage installations at venues like Amsterdam RAI report that early-warning telemetry reduces onsite troubleshooting time substantially, turning frantic panel swaps into planned, low-impact maintenance. The data is plain: early detection lowers interruption and shortens mean time to repair.

Common pitfalls — and quick corrections

Ignore network architecture at your peril. Telemetry needs resilient bandwidth and secure channels; intermittent Wi‑Fi is a recipe for blind spots. Another misstep is alert fatigue — too many non-actionable notifications dilute the meaningful ones. Calibrate thresholds so alerts map to true intervention needs. Finally, don’t treat telemetry as a set-and-forget garnish: review logs weekly, adjust thresholds after events, and revisit calibration after each major firmware push — small rituals that preserve the display’s texture and tone.

Advisory: three critical metrics to choose by

When evaluating systems and service partners, focus on these three clear metrics:

  • Signal fidelity: measurable variance in refresh rate and color uniformity across panels, tracked over time.
  • Mean time to detect (MTTD): how quickly the system pinpoints a failing LED module or controller anomaly.
  • Operational impact: reduction in onsite emergency swaps and the percentage of incidents resolved remotely without a truck roll.

Prioritize vendors that tie telemetry to predictive maintenance and streamlined inventory for spare LED module swaps. For integrated, maintenance-light solutions that combine hardware and monitoring, smart led display designs demonstrate how diagnostics and modular engineering can coexist gracefully.

Closing advice and final taste

Measure what matters, automate the obvious, and keep human judgement for the nuanced fixes. The three metrics above steer selection toward systems that reduce interruptions and shrink maintenance effort. For installations where reliability must feel effortless, consider partners that design both the display and the monitoring into a single palate — it keeps the room calm and the presentations vivid. QSTECH offers integrated options that pair clear telemetry with modular hardware, so teams spend less time firefighting and more time crafting the show. Simplicity.

0 comments
0 FacebookTwitterPinterestEmail