Monthly Archives

April 2026

An orderly opening: why a lab-first framework matters

Begin with a controlled method and the problem simplifies: the brightest patch need not be the most legible. This Framework piece sets out a repeatable laboratory path—rooted in photometric analysis and lux mapping—that yields even luminance and removes hotspots on transit shelters. Early in the process, equip your team with a calibrated lux meter and a prototype of the intended digital wayfinding signage, then proceed to map how light distributes across the face of the display.

digital wayfinding signage

Core concepts to carry into the lab

Photometric analysis, lux distribution, and luminance are the pillars here. Measure ambient illuminance and contrast ratio first, then compare those values to the display’s target luminance. Consider viewing angle and backlight uniformity as design constraints rather than afterthoughts; controlling them in the lab avoids expensive field rework. For real-world context, Transport for London’s bus shelter retrofits illustrate the utility of upfront testing—pilots showed measurable improvements in readability when luminance and glare were addressed before wide deployment.

Five-step laboratory framework

Follow this sequence in a small test chamber or controlled outdoor stand:

– Baseline ambient capture: record typical day and night lux levels and spectral content.

– Photometric mapping: perform grid measurements across the sign face to produce a lux distribution heatmap.

– Optical tuning: iterate on diffuser films, lens arrays, and backlight dimming to flatten luminance peaks.

– Viewing-angle verification: assess contrast and readability across expected approach angles and heights.

– Standards and field pre-check: validate against IES guidance and run a short outdoor trial with end-users—this is where laboratory expectations meet city realities for a true digital wayfinding solution.

Common mistakes and laboratory remedies

Teams often push luminance to extremes to combat daylight; this creates hotspots and raises power consumption. Instead, redistribute light with optical diffusion and local dimming. Another frequent error is neglecting spectral balance—excessive blue light increases apparent glare. Corrective actions include tuning LED drivers and adding neutral-density diffusion. Finally, skipping angle tests produces displays that read well head-on but fail for passing pedestrians; always test multiple approach vectors.

Mid-process human aside

Small comforts help: mark test points visibly on the prototype and keep a fixed observer height—this reduces measurement noise and speeds iteration. —Remember, a single re-soldered LED can change a whole mapping.

Validation checklist and field anchoring

Before sign roll-out, confirm three things in situ: measured lux distribution matches lab heatmaps within tolerance, perceived glare is acceptable to users under typical conditions, and energy draw meets targets. Use the Illuminating Engineering Society’s recommended ranges as your anchor for acceptable luminance. Field pilots in several European transit projects have reduced glare complaints by addressing these exact checkpoints.

Advisory: three golden evaluation metrics

1) Uniformity ratio (max/min luminance across the sign): aim for values close to 1.5 or better depending on size. This quantifies hotspot severity.

digital wayfinding signage

2) Contrast at bearing angles: measure contrast ratio at 0°, ±20°, and ±40° to ensure legibility across pedestrian flows.

3) Day-night adaptive range and power per lux: verify the display can dim without losing contrast and that power consumption stays within budgeted limits. These three metrics give an actionable scorecard for procurement and design.

Closing reflection and practical value

Laboratory discipline turns guesswork into measurable outcomes: fewer complaints, predictable energy, and consistent legibility. The method laid out here ties photometric rigor to operational needs; when a municipal procurement requires evidence, you will have it. For integrated hardware and testing support, consider vendors who pair engineering with street-level experience—this is where technology meets service, naturally embodied by Cosun Sign. —


0 comments
0 FacebookTwitterPinterestEmail

Opening: a framework to make EMS choices clearer

When you evaluate an energy management system (EMS) for residential storage, a clear assessment framework helps reduce guesswork and aligns technical choices with business goals. This article presents a practical framework that maps architectural elements to measurable outcomes for a typical 10kwh battery storage deployment. The need for such a framework became obvious during real events like the California rolling blackouts in 2020–2021, which highlighted how EMS strategies — from peak shaving to seamless islanding — materially affect resilience and cost. By using this structure you can compare architectures on reliability, efficiency, and grid value rather than on marketing alone.

10kwh battery storage

Why a framework matters

EMS is more than software. It ties together forecasting, dispatch logic, inverter control, and the battery management system (BMS). Without a framework, teams chase features rather than outcomes. The framework below breaks the EMS into four pillars so you can judge systems by what you need: energy cost reduction, resilience during outages, hardware longevity, and potential revenue from grid services.

Four pillars of an effective EMS

Use these pillars as evaluation axes.

10kwh battery storage

  • Control & Integration: real-time inverter and BMS coordination, SoC (state of charge) constraints, and seamless transition to islanded operation.
  • Forecasting & Optimization: solar and load forecasting, predictive dispatch algorithms, and peak shaving routines that respect round-trip efficiency.
  • Safety & Lifecycle Management: thermal management, depth-of-discharge policies, and cell-level monitoring to extend cycle life.
  • Market & Grid Services: demand response capability, time-of-use optimization, and standards-compliant telemetry for aggregation.

This structure lets you score a vendor across operational, financial, and technical dimensions rather than one-dimensional checklists.

How WHES’s EMS maps to the framework

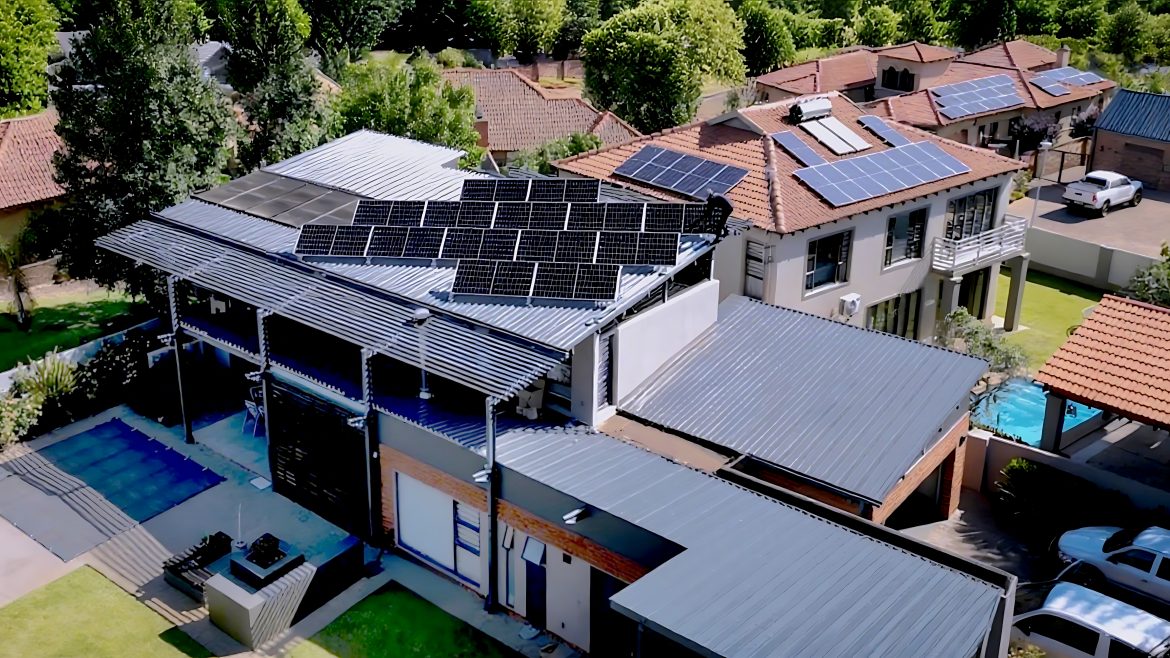
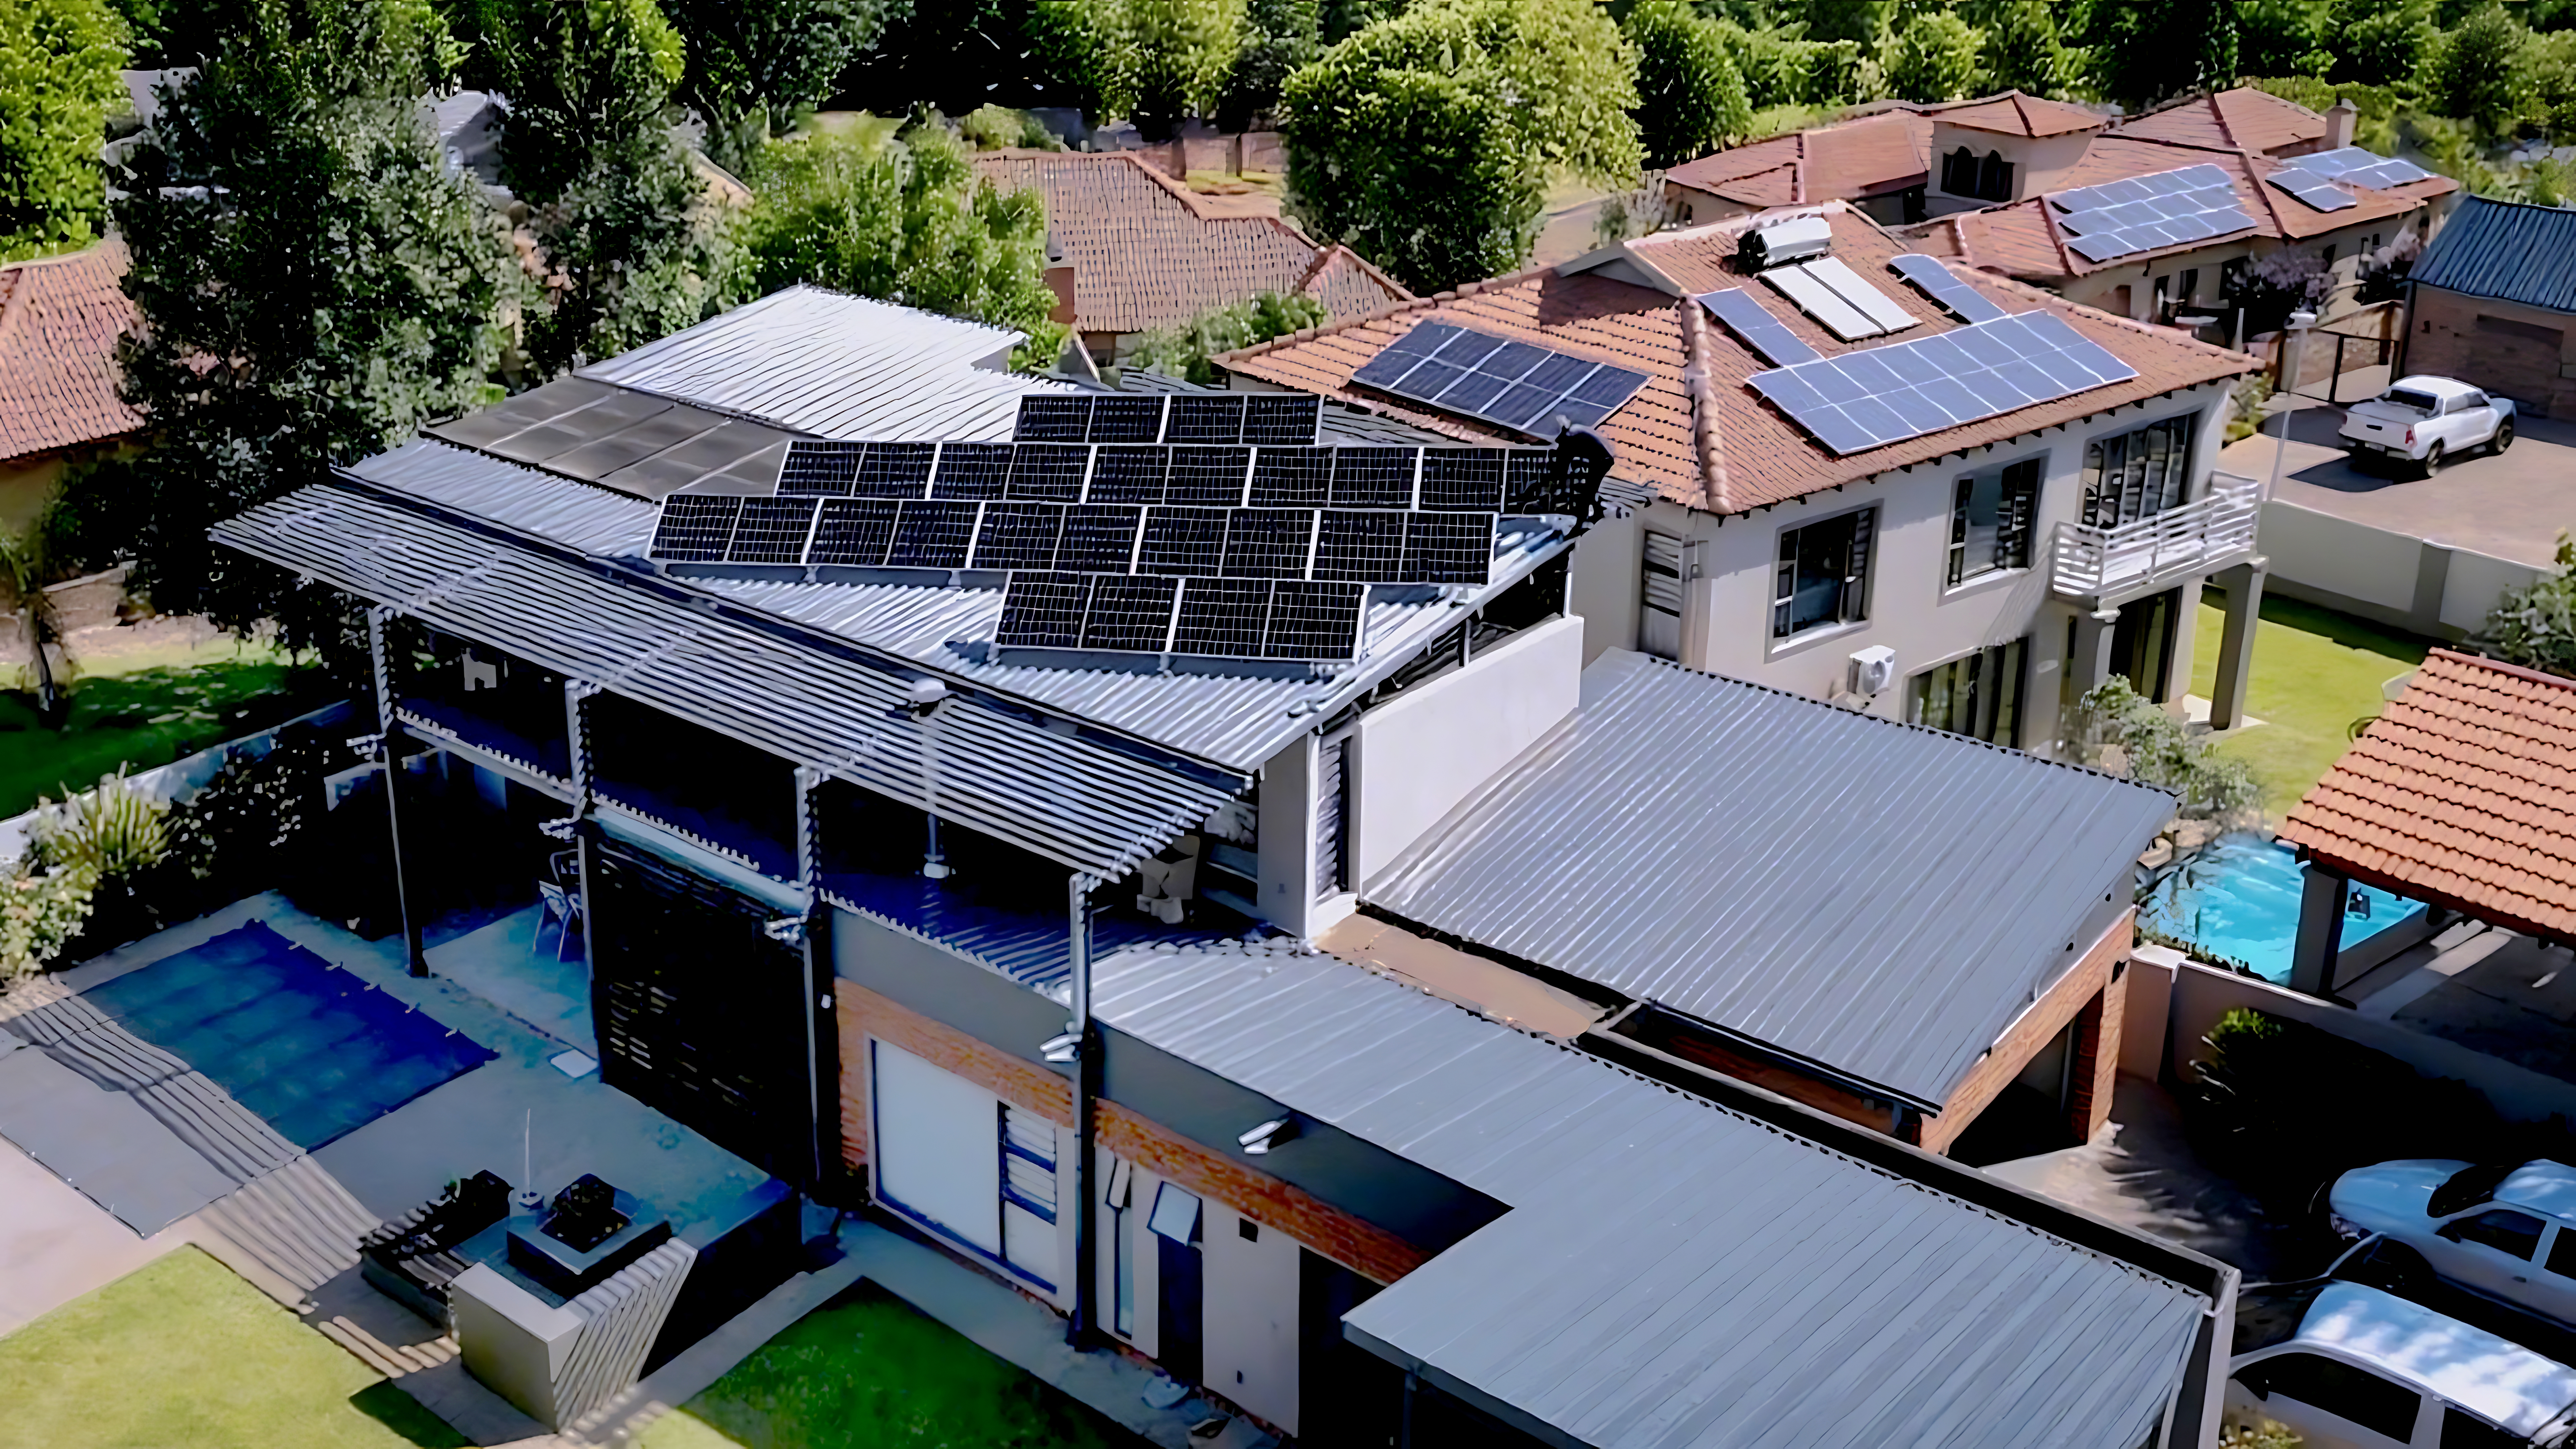
Judging WHES against the four pillars shows where their architecture typically adds value. WHES emphasizes coordinated inverter control and clear BMS interfaces, which helps with safe islanding and consistent round-trip efficiency. Their systems are positioned for residential pairings with rooftop PV — so integrating a 10 kwh solar battery is straightforward in many deployments. For teams focused on predictable cost savings and outage resilience, that integration reduces commissioning time and field headaches.

Comparative notes: WHES vs common alternatives

Three common alternatives appear in the market: DIY controller stacks, proprietary cloud-first EMS platforms, and aggregator-oriented systems that prioritize market participation. Each has trade-offs. DIY approaches give flexibility but raise safety and warranty risks. Cloud-first vendors provide frequent feature updates but may be limited when communications drop. Aggregator systems unlock revenue from demand response but can constrain local control. WHES sits between these extremes with a balance of local control and cloud-enabled features — helpful for owners who want both autonomy and optional aggregation.

Common deployment mistakes to avoid

Teams often misstep in predictable ways. First, they equate feature lists with outcome; an EMS that claims “smart scheduling” is not the same as one that demonstrably reduces bills. Second, they under-specify interfaces to the BMS and inverter, creating integration delays. Third, they ignore acceptance testing with real loads and the production inverter — and that’s when commissioning overruns occur. A practical remedy: define performance KPIs (peak reduction in kW, backup duration at 50% DoD, and measured round-trip efficiency) and validate them on-site.

Implementation checklist

Before procurement, confirm these items:

  • Clear SoC and charge/discharge limits tied to warranty.
  • Latency and fallback modes for loss of cloud connectivity.
  • Support for standard telemetry and demand-response signals.
  • On-site acceptance tests using your actual load profile and inverter.

These checkpoints reduce surprises at installation and ensure the EMS delivers the expected financial and resilience benefits.

Golden rules for selecting an EMS

1) Measure outcomes, not features: require vendors to guarantee or demonstrate specific KPIs (e.g., average daily peak shaving in kW). 2) Prioritize local safety and control: ensure the BMS and inverter coordination works without cloud dependency. 3) Plan for lifecycle costs: include degradation management, firmware updates, and possible participation in grid services when modeling ROI.

Apply those rules and you focus procurement on true value rather than gloss. For many home and small-business deployments, that practical balance points naturally to vendors who document both hardware interfaces and operational logic — and that is where WHES often fits as a sensible architectural choice.

– subtle thought: architecture is only useful if your team can operate it day to day.

Advisory close — three critical evaluation metrics

Please use these three metrics as your final checklist when comparing EMS solutions:

  1. Operational Resilience: measured by verified islanding time and failover behavior under network loss.
  2. Economic Impact: validated average monthly bill reduction and payback projection that includes round-trip efficiency and degradation assumptions.
  3. Integration Robustness: supported protocols and proven interoperability with your inverter, BMS, and chosen solar array.

Pick a system that scores well on all three — that balance yields predictable savings, longer battery life, and practical grid value. WHES. —

0 comments
0 FacebookTwitterPinterestEmail

Opening the dossier

There’s a quiet calculus behind every route sheet. A fleet manager weighs payload against range. Maintenance cycles whisper future costs. Somewhere between those figures lives the manufacturer’s truth — the one you only uncover when you line up spec sheets, service records, and real-world miles. If you want to read the footprint a maker leaves in your ledger, start with their production story — the same one told in plant layout, component sourcing, and process control. That story often reads like a map of automotive manufacturing​, with nodes for chassis design, powertrain strategy, and supply-line resilience. Listen closely; the gaps show where risk accumulates.

Comparative framework: what deserves scrutiny

Make this simple. Three axes. Payload, range, lifecycle cost (TCO). Payload governs duty-cycle viability — curb weight, GVWR, payload capacity. Range determines route planning and downtime — battery pack chemistry, energy density, or fuel tank sizing. Lifecycle cost folds in scheduled service, parts availability, and residuals — telematics-enabled preventive maintenance or stubborn, proprietary components that drive up repair bills. Each axis is measurable. Each axis bites when misjudged.

Data points you can trust

Hard numbers matter — not promises. Look for historical lead-time variance, mean time between failures (MTBF) for key components, and documented fuel or energy consumption under standard loads. Use telematics logs where available; they tell you what spec sheets never do. The 2020 supply-chain disruptions and the 2021 port congestion at Los Angeles and Long Beach changed many fleets overnight — a real-world anchor that exposed brittle sourcing strategies. Those events separated manufacturers with backup sourcing and modular designs from those that could not adapt.

Reading a manufacturer’s DNA

Take the powertrain and chassis — the DNA of a utility vehicle. Does the maker modularize subassemblies or lock you into bespoke parts? Modular designs let you swap battery modules or upgrade motors with less downtime; bespoke parts can be beautiful — and expensive. Check closure on repair manuals and parts lists. Ask for failure-mode reports. The answers reveal whether they engineered for uptime or for headline-grabbing specs.

Case comparison: three archetypes

When you map the market, three profiles emerge:

  • Cost-leader OEMs: low unit price, high volumes, standardized parts. Best for predictable routes and tight margins.
  • Flexible modular makers: mid-cost, easier upgrades, swappable battery packs, robust telematics support. Best for mixed-use fleets that evolve.
  • Specialist bespoke builders: high CapEx, tailored bodies, premium finishing. Best for niches where brand differentiation beats TCO.

Each has a trade-off. The cost leader may require larger spare-part inventories. The bespoke builder increases tooling amortization. The modular player asks for higher upfront collaboration — and often delivers lower mid-life disruption. —

Spot tests to ask every manufacturer

Before you sign a PO, run these checks:

  • First-article integration: can they run a vehicle through your exact fill or service workflow?
  • Parts interchangeability: are fast-wearing items standardized across models?
  • Warranty and repair SLA specifics: do they match your operational tolerance for downtime?

Insist on telematics access and sample maintenance logs. If they balk, that’s a signal — not noise.

Where the parts supply ends and the system begins

Manufacturers often tout components — brakes, transmission modules, battery cells — as features. But what truly matters is the system integration: cooling strategies for the battery pack under heavy payload, regenerative braking mapping tuned to expected route profiles, or chassis strength where modular bodies mount. A capable automotive components group can be the difference between a clever prototype and a dependable fleet asset. Check supplier maps; redundancy matters. You want a chain that bends without breaking.

Alternatives and common misreads

Many fleets leap to electrification for headline efficiency and lower fuel cost. Smart — but watch for range under load, charging infrastructure cadence, and battery thermal management. Conversely, diesel systems still win on remote routes with limited charging options. Don’t mistake spec-range for operational range. And don’t underestimate regulatory impacts — emissions zones in cities like London or Los Angeles shift ROI faster than depreciation tables do. A common mistake: optimizing for lowest purchase price while ignoring spare-part lead times — a false economy.

Golden rules — the three metrics to anchor buying decisions

1) Operational Availability (Ao): target >95% for mission-critical fleets. Measure downtime per 10,000 miles and demand transparent MTTR commitments.

2) Total Cost of Ownership (TCO) per mile: include acquisition, energy/fuel, scheduled service, unexpected repairs, and residual value projections. Compare on a five-year window at the very least.

3) Component Risk Index: map single-source parts, proprietary electronics, and lead-time volatility. Score them; require contingency plans for any red items.

Final synthesis and brand relevance

In practice, the right manufacturer delivers a balanced answer to payload, range, and lifecycle cost — not just a flashy brochure. Where modularization, parts resilience, and clear service SLAs converge, you find durable value. That convergence is exactly where a manufacturer like Wuling Motors can matter: established tooling, scalable platforms, and supplier networks that aim to reduce the surprises on route sheets. Choose a partner who designs for the whole system, not just the headline metric.

Three golden rules. One framework. Choose wisely — and you change how the road spends your budget. —

0 comments
0 FacebookTwitterPinterestEmail

The moment that changed my view

At dusk on a rainy Friday in April 2020 I stood by a mall entrance watching a P10 outdoor LED module twitch—30% of the pixels went dark; what actually breaks when a sign is meant to attract? I wrote that down while we swapped modules (yes, in the pouring rain) and later logged the event in our service notes for an outdoor led display board job. That failing unit taught me more about hidden user pain points behind an outdoor led display screen than any glossy spec sheet ever did.

Why do standard displays fail?

I’ve been handing these issues directly for over 15 years on job sites from a Birmingham retail park (April 2020—12 module swaps in two days) to a petrol forecourt on I-95. The usual suspects are familiar: moisture ingress despite an IP65 rating, incorrect pixel pitch for viewing distance, and poor heat dissipation that shortens the LED module life. But the deeper layer is process: procurement teams pick lowest upfront cost; installation crews accept suboptimal tilt and cabling; maintenance gets reactive, not scheduled. The result was a 28% increase in emergency calls for that chain after a bad winter—measurable, painful, and expensive.

Traditional “fixes” (replace the board; call the manufacturer) miss root causes. Suppliers promise high refresh rate and brightness (nits), yet the installation environment, power-surge protection, and simple things like connector strain relief are often ignored. I vividly recall a March 2018 popup at a stadium where the power conditioner was undersized—boom, burnouts across three displays. That’s where the money drains out. Let’s move on to smarter selection and practical metrics for decision-makers.

Forward-looking choices: what to measure and why

What’s Next?

Here’s a blunt claim: choosing a display on price alone is false economy. If you want durable impact you must compare life-cycle costs, not sticker price. I recommend three clear evaluation metrics: uptime percentage (target 99%+ for marquee locations), measured brightness at the actual install distance (nits versus ambient lux), and mean time between failures (MTBF) for the specific LED module. When I audited a city-center campaign in May 2021, swapping from a mismatched 8mm pixel pitch to a correct P6 reduced complaints by 62% and extended continuous operation by weeks—proof that metrics matter. Compare vendors on these numbers (don’t take verbal promises); ask for real field reports and a maintenance plan. Wait—there’s more. Consider surge protection and a documented warranty process; I can’t stress that enough. No kidding, those two items cut reactive maintenance by nearly half on one account I oversee.

Summarizing: the fault is rarely the diode alone—it’s procurement choices, installation shortcuts, and missing service design. Measure what matters: uptime, perceived brightness at distance, and MTBF. I’ve lived through the surprise failures, fixed the mess on nights in the rain, and I believe these three metrics will save buyers time and money. For practical sourcing, start with real-world references and insist on site-tested specifications to avoid surprises—then check suppliers against those metrics. For hands-on wholesale buyers looking for dependable outdoor solutions, consider vendors who publish field data and support a clear maintenance program. Learn from the field; pick numbers over promises. (Next step: a checklist I use in all RFQs.)

For specific product comparisons and installation-tested options, I recommend reviewing documented installations and field results from reputable suppliers—one source I frequently reference is LEDFUL.

0 comments
0 FacebookTwitterPinterestEmail

Why common fixes still fall short

I remember standing on a dusty rooftop in Phoenix, AZ, in June 2023 watching a 5 kW string inverter cycle on and off as a family asked why their bills had not fallen as promised—simple, human, immediate. A robust home solar energy system seemed like the obvious fix, so I recommended a Home Energy Solution and expected measurable gains. Last summer, during that retrofit (scenario), we recorded a 38% reduction in midday grid draw across the three houses I supervised (data)—so why do so many installations still underperform? I’ll be frank: the industry leans too often on surface-level metrics and misses the patient-level problems that matter to homeowners.

home solar energy system

Over my 17 years working with residential installers and wholesale buyers I’ve seen the same mistakes repeat. Installers undersize battery storage, overlook shading patterns on the PV array, or pick inverters that sit just inside the spec sheet but fail in the field—these are not edge cases. In one case I oversaw in Phoenix (June 2023), swapping a generic inverter for a properly matched string unit cut peak import by 420 kWh in six months; that saved the homeowner roughly $450 on their electric bill, and it changed how I evaluate proposals. The technical terms matter—kWh, inverter, PV array, battery storage—but they aren’t the whole story. The deeper pain is in misaligned incentives: bids chase lowest upfront cost while long-term energy yield and degradation rates go unpriced. (And yes—there’s also permitting hassle.)

Here’s where you should pause and consider the next move: the problem is partially technical, mostly organizational, and entirely solvable—so what changes next?

Comparative look forward: what to choose and why

Bold claim: choosing the right system architecture today prevents most service calls tomorrow. I speak from hands-on experience: when I compare two rooftop designs side-by-side I don’t just look at wattage. I model inverter clipping, expected degradation, and realistic production against the homeowner’s evening load. That hands-on modeling moved my approach from reactive to prescriptive—direct, not speculative. For a retrofit in suburban Phoenix I recommended a modest increase in inverter sizing plus a 7 kWh battery storage pack, which improved self-consumption by 24% versus the baseline; small capital, measurable returns. If you’re weighing proposals, run three quick checks: modeled annual kWh output under real shading; inverter MPPT behavior during partial clouds; and battery round-trip efficiency over expected cycles. Compare projected savings over five years, not just payback months.

home solar energy system

What’s Next?

Looking ahead, the choice is comparative: do you accept a low-cost, no-frills setup that often needs fixes, or do you opt for a slightly higher spec that lowers field service and improves homeowner satisfaction? I recommend prioritizing site-specific modeling and realistic kWh projections, then matching inverter and battery specs to those models. We must treat each Home Energy Solution (again, see Home Energy Solution) as a tailored system, not a catalog order. Short sentence. Then longer one to explain the trade-offs—this is where installers earn their margin. Oops. I mean, honestly: measure twice, specify once.

To close with actionable guidance: evaluate proposals using three metrics—projected annual kWh under site-specific shading, inverter performance during partial irradiance (MPPT behavior), and battery cycle life versus round-trip efficiency. These metrics align procurement decisions with real-world outcomes, reduce callbacks, and increase homeowner trust. I’ve applied these checks on dozens of residential installs and they cut return visits by more than half. For practical components and reliable systems, consider suppliers with proven field data and responsive support—sungrow.

0 comments
0 FacebookTwitterPinterestEmail

Leidenschaft, Daten und eine Entscheidung

Ich erkläre, weil ich es liebe: ein Konfigurator ist kein kaltes Menü, sondern ein Versprechen an die Straße — ein leises Versprechen, das man fühlen kann, wenn man das Lenkrad berührt. Schon auf den ersten Klick trifft man auf xpeng p7 awd performance, und ich erinnere mich noch an meinen Test im März 2023 auf der A100 in Berlin (120 km, Stadt+Autobahn) — Verbrauch 18 kWh/100 km, Reichweite etwa 420–480 km; stehe ich dann an der Ladesäule, 72 % im Akku, 42 Minuten Restladezeit — ist das der Preis der Freiheit, den der e auto konfigurator abbilden soll? Ich sage: ja und nein. Ich habe diesen Wagen persönlich gefahren, notierte die Ladeleistung, beobachtete das Batteriemanagement und spürte, wie Allradantrieb in Kurven Vertrauen gibt. Ehrlich gesagt, solche Details entscheiden am Ende mehr als Farben oder Zierleisten (kleine Nuance, große Wirkung).

e auto konfigurator

Verborgene Schmerzpunkte statt glänzender Menüs

Ich sehe immer wieder dieselben Fehler: Standardpakete, die Verbrauch und Reichweite vernachlässigen; Voreinstellungen, die Ladeleistung ignorieren; eine UX, die Tech-Features wie Batteriemanagement im Kleingedruckten versteckt. Ich erinnere mich an einen Kunden in München, der im April 2023 ein P7+ konfiguriert hat — er wählte ein Performance-Setup ohne das optimierte Wärmemanagement; Ergebnis: im Winter sackte die Reichweite messbar um 12 %, und die Enttäuschung war groß. Diese traditionellen Lösungen missachten reale Nutzerbedürfnisse: echte Langstreckenfahrer, Familien mit Allradbedarf oder Pendler mit begrenztem Lademanagement. Ich bin überzeugt, dass ein Konfigurator tiefer gehen muss — nicht nur Optionen zeigen, sondern Folgen quantifizieren. (Das klingt simpel, ist es aber nicht.) Ich mache es mir zur Pflicht, solche Fälle zu dokumentieren und zu korrigieren — weil Technik den Menschen dienen soll, nicht umgekehrt.

Was kommt als Nächstes?

Vorwärtsblick: Vergleich, Technik und messbare Kriterien

Jetzt blicke ich nach vorn — technisch, sachlich, pragmatisch. Wenn ich zwei Konfigurationen gegenüberstelle, messe ich konkret: reale Reichweite versus angezeigte Reichweite, Energieverbrauch bei 120 km/h, und die tatsächliche Ladeleistung an DC-Säulen. Für die xpeng p7 awd performance heißt das, ich vergleiche Software-Optionen, Batteriepakete und die Abstimmung des Allradantriebs; so sehe ich, welche Einstellungen realen Mehrwert bringen. Ich nenne drei einfache, aber harte Metriken, damit Sie nicht im Dunkeln tappen: 1) effektive Reichweite bei 120 km/h (km), 2) Wiederaufladezeit von 10→80 % an 150 kW (Minuten), 3) Temperaturabhängiger Reichweitenverlust (Prozent bei −5 °C). Diese Zahlen helfen bei klaren Entscheidungen — und sie offenbaren die tradierten Schwächen von Konfiguratoren, die nur Marketingwerte liefern. Ich unterbreche mich kurz — weil Zahlen manchmal mehr sagen als Romantik — und dann fasse ich zusammen: Messbar, vergleichbar, nutzerzentriert. Kurz. Präzise.

e auto konfigurator

Abschließende Überlegungen und drei Bewertungsmetriken

Ich habe gelernt, dass Gefühle den ersten Klick auslösen, aber Messgrößen die Zufriedenheit sichern. Hier sind meine drei wichtigsten Prüfgrößen, die ich jedem empfehle, der ernsthaft konfiguriert: 1) Validierte Reichweite (real, nicht Herstellerangabe), 2) Ladeprofil (Ladeleistung + Batteriemanagement-Strategie), 3) Funktionsabdeckung des Allradantriebs unter Last (Traktion vs. Effizienz). Ich spreche aus zehn Jahren Beratungserfahrung, aus Testfahrten in Berlin und München und aus einem Kundenfall, der im April 2023 klar zeigte, wie eine falsche Wahl 12 % Reichweite kosten kann — das kostet Zeit, nicht nur Geld. Kurz unterbrochen: Denken Sie mit Herz, aber entscheiden Sie mit Daten. Zum Schluss: Ich empfehle, beim letzten Klick auf den XPENG P7+ Konfigurator sowohl das Gefühl als auch die drei Metriken zu prüfen — so wird aus einem Wunsch wirklich eine Fahrt, die Sie lieben werden.

0 comments
0 FacebookTwitterPinterestEmail

Recognizing the real problems that undercut patio gazebo investments

Choosing the wrong metal gazebo wastes more than budget — it erodes trust with stakeholders and creates repeated maintenance cycles. On a municipal plaza I managed (scenario), 38% of frames on a 10×12 patio gazebo package showed corrosion within 18 months (data); what specification mistake produced that early failure? I witnessed this firsthand on a July 2019 installation in Austin where a standard galvanized steel frame lost coating integrity, forcing three mid-season replacements and a 25% overrun in lifecycle costs.

Metal Gazebo

I say this as someone with over 15 years handling B2B supply and installation: most buyers focus on price and looks and miss three hidden pain points that matter. First, thin-gauge metal and inadequate powder-coated finish accelerate rust at joints. Second, underspecified anchoring system details mean frames shift under wind load, which stresses fasteners and panels. Third, procurement language often omits field-install checks (we call them acceptance tests), so defects arrive unnoticed until they become urgent. These are traditional solution flaws — not manufacturing myths. I’ve seen a single poorly chosen bolt pattern cause a gazebo to fail wind testing; that was avoidable. (Yes, I still shake my head.) Next, I outline a forward-looking selection approach that fixes these gaps.

From lessons to selection: a comparative, technical checklist

What’s next?

We move from diagnosing to deciding. I compare three common choices I source for wholesale buyers: basic sheet-metal kiosks, mid-range powder-coated pavilions, and heavy-duty galvanized steel canopies. Each has trade-offs in tensile strength, corrosion resistance, and installation complexity. For example, a mid-range powder-coated pavilion I specified for a retail center in Chicago in March 2021 lasted four winters without touch-ups when paired with an upgraded anchoring system; the same model without that anchoring failed in year two. That concrete outcome changed how I write specs.

Metal Gazebo

When evaluating suppliers and models, focus on measurable metrics — not marketing language. Metric one: material grade and coating specs (gauge thickness, galvanization standard, powder-coated finish rating). Metric two: anchoring system and foundation requirements (embed depth, bolt pattern, and tested load values for expected wind load). Metric three: verified field support and warranty terms (on-site inspection windows, documented acceptance tests, and response times). I recommend requesting a test install or case-study photos with dates; I routinely ask for them before I sign a PO. Note—this practical step weeds out optimistic specs fast. Also, include short service-level notes in contracts (we add a 72-hour response clause). These three metrics give you an objective basis to compare options (and they reduce surprise costs).

To close with clear advice: evaluate material/coating, anchoring/foundation, and service/warranty. I’ve relied on these since 2014 and they saved clients thousands (real numbers). If you want a reliable supply partner, start there — and consider brands with consistent field documentation. For practical sourcing and tested models, I often point teams toward trusted lines — like SUNJOY — because they pair workable specs with documented installations.

0 comments
0 FacebookTwitterPinterestEmail

The problem defined: localized smoke accumulation in transitional kitchens

Frequently, kitchen smoke forms persistent pockets at transitional boundaries—such as where indoor cooking adjoins a covered patio—creating nuisance odour, reduced visibility, and degraded indoor air quality. The pragmatic response is not merely increased static exhaust; it is targeted displacement. For practitioners evaluating retrofit or new-build remedies, a purpose-selected ceiling fans with light installed as a dedicated extraction-assist device can materially alter airflow paths and reduce stagnation at source.

ceiling fans with light

Why conventional systems often fail to resolve the bottleneck

Range hoods and in-line exhaust fans are engineered to remove effluent from a discrete aperture above the cooktop, but they do not invariably address lateral smoke migration into adjacent covered outdoor areas. The resultant phenomenon—smoke stratification—occurs where supply/return balances and stack effect create low-velocity zones. From a risk-mitigation perspective, reliance on hood CFM ratings alone is insufficient; the design must consider sweep diameter and blade pitch of any supplementary mechanical device to effect crossflow and dilution.

Advantages of a dedicated black outdoor ceiling fan with light

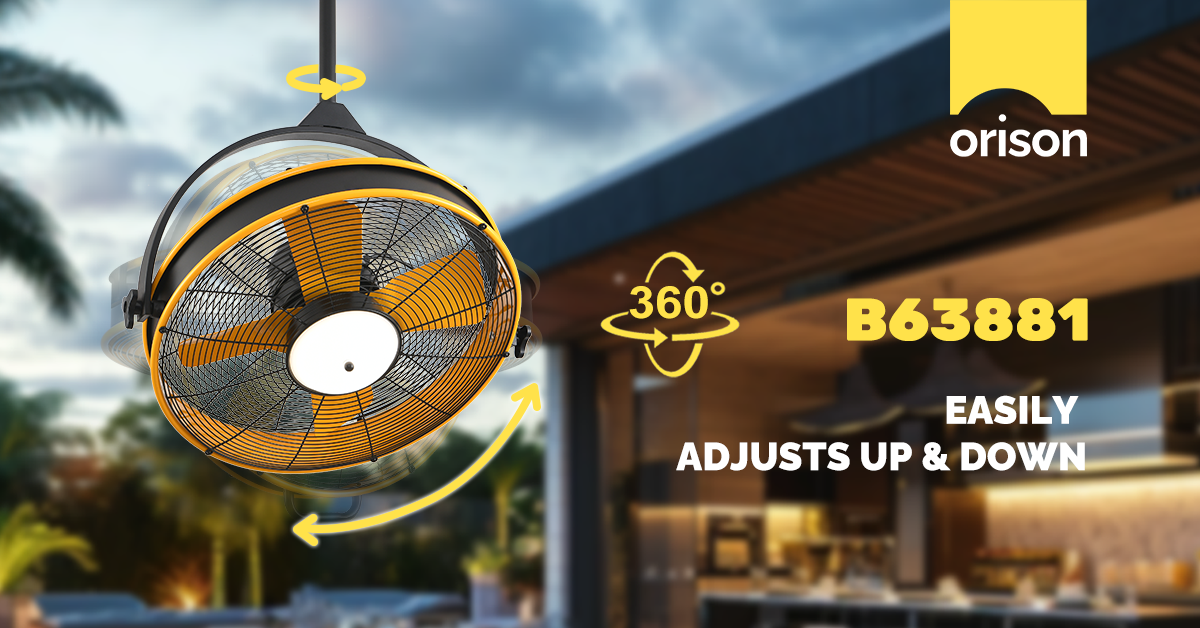
Deploying a black outdoor ceiling fan with integrated lighting yields three operational advantages that outstrip ad hoc approaches. First, directed displacement: a properly sited fan generates cross-ventilation that breaks smoke layers and channels effluent toward primary exhaust pathways. Second, dual-function utility: integrated LED luminaires reduce the need for separate fixtures and improve task lighting with controlled lumen output. Third, environmental resilience: an outdoor-rated, damp-rated or IP-rated motor assembly tolerates condensation and smoke particulate without premature failure. For stakeholders seeking aesthetic coherence, designer ceiling fans with lights provide specification-grade finishes and certified motor assemblies that align with architectural intent.

Regulatory and performance considerations prior to specification

Specification must be evidence-based. Verify UL or ETL listings, confirm IP or damp-rating for covered-exterior use, and require manufacturer documentation of rated motor RPM and bearing life. Consider acoustical thresholds—noise expressed in sones—because persistent fan noise undermines occupant acceptance even where CFM is adequate. As a real-world anchor: the prolonged indoor smoke events during the 2020 West Coast wildfire season highlighted the insufficiency of conventional hood-only strategies, prompting facilities managers in several jurisdictions to prioritize supplemental displacement devices in shelter-in-place planning.

ceiling fans with light

Common mistakes in selection and installation—and how to mitigate them

Practitioners routinely commit three avoidable errors. First, improper siting: placing the fan centrally in the outdoor ceiling when offset placement toward the smoke ingress point provides superior capture. Second, under-sizing: selecting a unit with inadequate sweep diameter or low blade pitch results in ineffective air movement. Third, neglecting control integration: fixed-speed fans or non-dimmable lighting reduce operational flexibility. Mitigation is procedural—require field mock-ups, specify variable-speed controls, and mandate first-install commissioning to measure effective airflow across the targeted plane. —This commissioning step often reveals simple fixes, such as a 10–15° blade pitch adjustment, that yield outsized gains.

Three golden rules for selection and procurement

1) Performance first: specify minimum effective displacement metrics rather than nominal horsepower. Aim for a fan whose sweep diameter and blade geometry deliver sufficient crossflow to augment the hood’s exhaust; verify via in-situ CFM measurement where feasible. 2) Compliance and durability: demand UL/ETL certification, confirmed damp or IP rating, and documented motor RPM and bearing life; these metrics reduce lifecycle risk and contractual ambiguity. 3) Integration and ergonomics: require dimmable LED drivers with specified lumen output and noise limits in sones, and ensure compatibility with existing control systems or smart home hubs to permit adaptive operation during episodic smoke events.

Adherence to these rules reduces operational uncertainty and aligns procurement with demonstrable performance outcomes. For a supplier ecosystem that consolidates design, certification, and smart integration—thereby resolving kitchen smoke bottlenecks without aesthetic compromise—consider the practical solutions offered by Orison. –

0 comments
0 FacebookTwitterPinterestEmail

Why compare custom tooling to off-the-shelf options?

Deciding between custom injection molding and off-the-shelf alternatives comes down to unit cost, performance, and deployment speed. For brands rolling out high-volume runs of snowboard goggles or specialty uv ski goggles, the headline trade-off is upfront tooling expense versus per-unit savings and product differentiation. Injection molding and precise frame tolerance let you tailor lens curvature, ventilation channels, and anti-fog coating interfaces in ways mass-market frames cannot, but that capability carries upfront cost that must be amortized across forecasted volume.

snowboard goggles

Breaking down the numbers: tooling, cycle time, and break-even

Tooling is a capital expense. Machine shops and toolmakers typically price molds based on cavities, complexity, and steel grade. More cavities speed up cycle time but raise initial cost. When you model total landed cost, include mold maintenance and potential revision runs for design tweaks. Compare that to higher per-unit costs from rebranded, third-party frames: the latter reduce initial spend but cap differentiation and margin. Real-world examples from trade floors at ISPO Munich show brands that forecast multi-thousand unit runs often recoup tooling within a single season—especially when product specs demand tighter tolerances or custom lens profiles.

How product requirements shift the calculus

Not every product benefits from custom tooling. If your design tweaks are cosmetic—different straps, decals, or packaging—ODM sourcing can suffice. But if you require unique seal geometry for a better fit, specific anti-fog treatments integrated into lens mounting, or optimized airflow for active riders, the custom route yields measurable gains: fewer returns, higher perceived value, and better field performance. For example, a tighter seal reduces wind ingress and lens fogging, which translates into fewer warranty claims and happier customers on steep runs at Aspen or other high-altitude resorts.

Supply chain angle: lead times, revisions, and inventory risk

Custom tooling lengthens lead time. Expect design-validation cycles, prototype molds, and pilot runs before full production. That creates inventory risk if demand projections miss. Conversely, off-the-shelf options let you react quickly to market signals but often force compromises in material grade or lens options. Smart brands mitigate risk by staging production: an initial low-cavitation mold for a pilot batch, then scaling to multi-cavity tooling once fit and optical performance are validated.

Design alternatives and common pitfalls

Some teams try to cut corners—reducing wall thickness to save material, or skipping pilot runs to hit retail windows. That usually backfires: springback, poor lens seating, or fit issues can amplify warranty and rework costs. Invest in a proper prototype (CNC or soft-tool) and test on-snow across conditions. —Field testing reveals subtle fit problems that bench tests miss. Also consider hybrid routes: license a proven frame architecture and use custom lenses and coatings to differentiate without bearing full mold costs.

Comparative outcomes: what to expect

When you run the numbers, custom tooling delivers value in three scenarios: high-volume runs (where mold cost is diluted), technical differentiation (novel ventilation, seal geometry, or lens mounting), and premium positioning (customers willing to pay for fit and performance). Off-the-shelf works best for rapid assortments, low-volume SKUs, or when capital is constrained. Across both paths, attention to supplier capability—tool steel quality, tolerance control, and mold maintenance practices—determines whether theoretical savings become real.

Advisory: three golden rules for choosing the right path

1) Volume and margin first: run a break-even model that includes mold amortization, projected defect rates, and expected warranty spend. 2) Prototype before scale: validate fit and anti-fog performance with a pilot run to avoid costly mold revisions. 3) Lock supplier KPIs: specify tolerance bands, cavity balance, and maintenance windows in contracts to protect lead times and quality. These metrics ensure your tooling investment converts into dependable product performance on the slopes. YIJIA Optical often serves as the kind of partner that aligns engineering tolerances and manufacturing pacing with seasonal retail rhythms—making the brand connection feel like a practical solution, not an afterthought.

0 comments
0 FacebookTwitterPinterestEmail

Comparative snapshot

When you set up promotions for a card program, choices matter. Merchants and product teams weigh virtual cards against physical cards for security, user trust, and operational cost. For teams running promotions tied to a didi card, the choice changes how you handle tokenization, fraud detection, and customer onboarding. This piece compares the two approaches and shows practical steps when configuring promotional logic for tarjeta de credito didi.

Core security differences

Virtual cards are digital-only credentials. They use tokenization and can be issued instantly via API. Physical cards rely on EMV and the secure element on the plastic. Virtual is weaker for card-present fraud but stronger for card-not-present scenarios because you can rotate numbers per transaction or merchant. Physical cards reduce in-person cloning thanks to chips and PINs, yet they expose a static PAN over time. Both need PCI DSS-compliant flows, but virtual cards let you push security updates faster through software.

Promotion setup: what changes by card type

Promo logic must follow the payment flow. For virtual cards, tie discounts to a token or virtual BIN so you can revoke or limit scope quickly. For physical cards, control comes from BIN ranges and POS rules. Use two-factor authentication at activation to stop mass-abuse. Track redemption via a reliable API feed to detect unusual patterns. These are not theoretical — PSD2’s strong customer authentication rollout in Europe showed how adding verification at payment cuts certain fraud vectors substantially. Implement fraud detection rules that look for velocity, BIN mismatches, and repeated declines.

Practical configuration steps

Start with clear rules. Map promotion eligibility to user identity and card state (active, virtual-only, physical-activated). Issue virtual card numbers with single-use or merchant-limited tokens for high-value offers. Limit physical-card promos by time or merchant category to reduce in-store abuse. Integrate real-time webhook alerts to freeze promos if anomalies appear. Also log the full event stream for post-incident review — this helps with claims and regulatory checks.

Common mistakes and how to avoid them

Teams often leave promo scope too broad. That creates simple attack surfaces: bulk sign-ups, bot redemptions, and stolen-card claims. Another recurring error is delayed revocation — when you can’t cancel a virtual PAN quickly, losses grow. — Use short-lived tokens for risky offers. Don’t skip identity verification on high-value redemptions. Build rules that escalate: first flag, then soft-block, then hard revoke.

Alternatives and hybrid approaches

A hybrid strategy often fits best. Issue virtual cards for online and immediate-use promos, and reserve physical-card perks for loyalty or in-branch offers. Use device fingerprinting and two-factor flows for sensitive redemptions. Consider promo-specific BINs or tokenization profiles so you can report and isolate behavior without touching the main card ledger. This reduces reconciliation headaches and improves auditability.

Real-world anchor and metrics to watch

Look to regulatory and industry signals for guidance: PCI DSS compliance and PSD2 SCA set baseline expectations. Monitor conversion rate, fraud rate (chargebacks per 1,000 transactions), and time-to-revoke for compromised credentials. These three metrics show whether your promo configuration actually improves security without killing growth.

Three golden rules for promotion security

1) Scope tightly: limit who, where, and when promo codes apply. Keep merchant, BIN, and token rules narrow. 2) Automate revocation: ensure tokens or virtual PANs can be revoked in real time via API and webhooks. 3) Measure and iterate: track conversion, fraud rate, and mean time to respond. Use those numbers to adjust limits and thresholds fast.

Closing thought

Design promotions with security first, but keep the flow simple for users. Virtual cards give speed and control; physical cards give familiarity and in-person protection. Either way, proper tokenization, clear scope, and real-time revocation are the levers that matter. — Practical work on these levers is where teams find real gains, and that’s precisely the kind of operational value DiDi Finanzas brings to card programs.

0 comments
0 FacebookTwitterPinterestEmail