Category:

Business

User-first thinking: what homeowners really need

Most people want reliable power at home — lights, fridge, router, all of it — without surprises. For many in Hong Kong after Typhoon Mangkhut in 2018, resilience became a must-have rather than a nice-to-have. Start by focusing on daily load patterns and critical circuits, then match hardware that supports those needs. If you’re comparing options, include commercial inverters early; they change how a system behaves under heavy load and during outages.

commercial inverters

Right-sizing: hardware, capacity, and the trade-offs

Successful whole-house systems balance PV array size, battery capacity, and inverter capability. A commercial hybrid inverter sits at the centre of that balance — it manages grid interaction, battery charging, and export limits. Look for inverter efficiency numbers, MPPT count for your string layout, and a solid battery management system (BMS). Common mistake: oversizing panels but under-specifying inverter continuous power, which causes clipping and wasted generation — not smart, lah.

Installation realities and everyday operations

Good installation is simple to explain but tricky to execute. Keep panels shaded as little as possible; mount angles that match seasonal sun for Hong Kong’s latitude; secure conduits and weatherproof junctions. Pay attention to AC coupling versus DC coupling choices — each affects how batteries integrate and how islanding protection works. Monitoring and firmware updates are not optional; they prevent subtle faults becoming outages. — People often forget periodic firmware checks until a storm reveals the gaps.

commercial inverters

Common mistakes and better choices

Skip these recurring errors and your system will last longer: underestimating surge loads from aircon compressors, ignoring thermal derating of inverters, and picking a warranty without fast service options. Better approach: specify peak inverter output at least 1.2× your expected surge, choose an inverter with thermal management and active cooling, and confirm local service SLA. For businesses or larger properties, the commercial hybrid inverter is usually the smarter investment because it scales with layered backup strategies and export control needs.

Comparing configurations: grid-tied, off-grid, and hybrid

Grid-tied gives best cost-per-watt but zero resilience during outages unless paired with backup. Off-grid offers full independence but needs much larger battery banks and complex load management. Hybrid systems give a middle path: they allow daytime exports, charge batteries, and run essential circuits during grid loss. If you want to power a whole house while still keeping export flexibility for net metering, hybrid systems with multiple MPPTs and modular battery packs are practical.

Installation checklist and maintenance rhythm

Practical checklist: document circuit-level loads, verify inverter continuous rating, design string layouts for uniform irradiance, and include remote monitoring. Schedule visual panel checks twice a year, clean bird guards, and review inverter event logs monthly. Small upkeep prevents big downtime later — it’s that straightforward.

Three golden rules for choosing the right system

1) Efficiency and round-trip performance: target high inverter efficiency plus battery round-trip ≥85% for systems meant to cover daily loads. Measurable result: higher usable kWh per installed kW.

2) Scalability and modularity: pick hardware that accepts extra PV strings and battery modules without full replacement. Expect to grow capacity by 30–50% over five years for most households.

3) Service and warranty clarity: ensure response times, on-site support windows, and transparent warranty terms (covering inverter cooling fans, capacitors, and firmware updates). Real uptime is delivered by timely repairs, not promises.

These three rules make the difference between an installation that’s neat on day one and one that still delivers power five years later. For practical deployments in urban centres like Hong Kong — where storms and peak demand matter — the right commercial hybrid inverter architecture naturally becomes the backbone of resilience. SOLINTEG. —
0 comments
0 FacebookTwitterPinterestEmail

Setting the Scene — why the comparison matters now

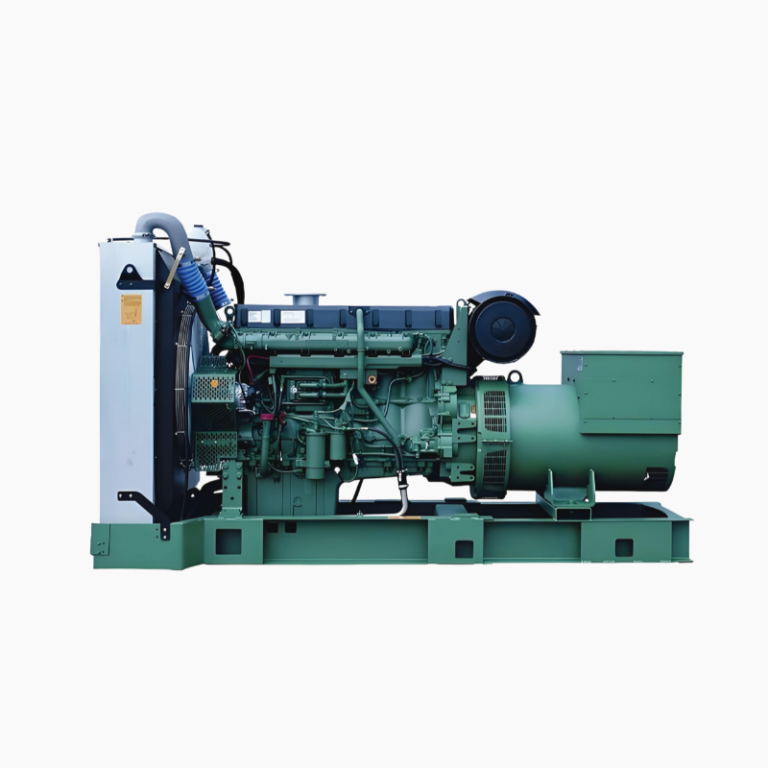
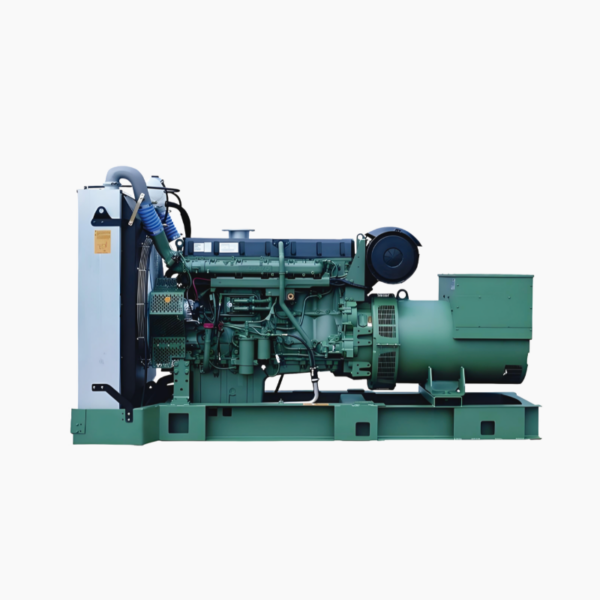
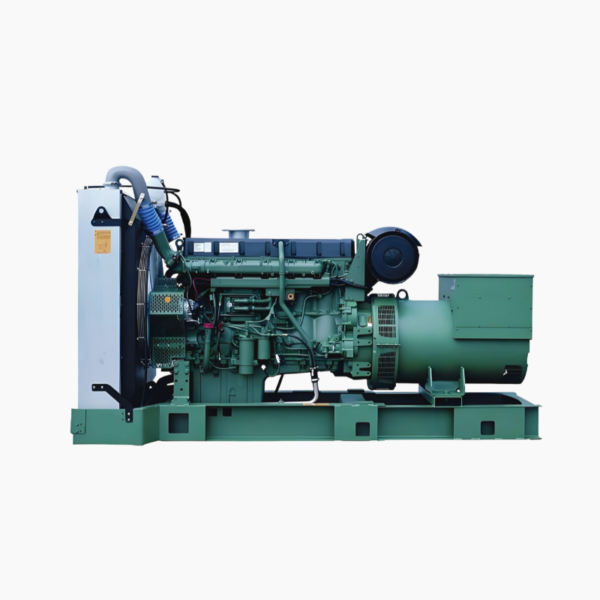
The push to balance reliability, cost, and cleaner operation has never felt so immediate for ship operators and naval architects. The decision between a traditional diesel genset and newer options shapes fuel contracts, maintenance plans and compliance with rules like IMO 2020. For many operators, the practical benchmark remains a trusted unit such as a volvo genset, whose pedigree in marine prime power gives a useful baseline for efficiency and serviceability. Familiar terms like genset, kW rating and fuel consumption still guide procurement, but the trade-offs have broadened.

volvo genset

Comparative snapshot: diesel genset versus alternatives

Diesel marine gensets deliver predictable output and long service intervals; they excel at continuous auxiliary loads and emergency power. Alternatives—battery-hybrid systems, LNG-fueled gensets, and increased shore power use—lower onboard emissions and can reduce operating expense on select routes. Across these options, three operational attributes repeatedly decide outcomes: fuel consumption, emissions profile and integration complexity. Real-world anchors are useful here: international estimates place shipping emissions at roughly 2–3% of global CO2, and port electrification pilots in Rotterdam and elsewhere demonstrate shore power’s real benefits at berth.

When diesel keeps the edge

Diesel still wins where mission critical uptime and refuelling infrastructure are essential—long-haul vessels, remote service boats, and many workboats. Diesel gensets handle variable loads well because of mature engine governor systems and established maintenance chains. Capital expenditure is lower than full hybrid retrofits, and technicians worldwide know diesel systems intimately. However, operators too often underbudget for lifecycle fuel costs and overlook derating the genset for continuous prime power duty—common mistakes that raise long-term cost.

Where alternatives reshape operations

Battery-hybrid setups and LNG reduce emissions during operation and can cut port fees tied to local air quality. Hybrids improve transient response and allow genset downsizing, which reduces wear. Shore power eliminates onboard emissions when available, but it demands compatible electrical systems and consistent shore-side infrastructure. Integration complexity can bite projects; underestimated switchgear upgrades, or failing to model peak load scenarios with a load bank, are practical missteps that delay commissioning. —A small planning note: early coordination with port authorities saves months of rework.

Choosing a balanced strategy

Operators often pursue a mixed architecture: retain a reliable diesel genset for redundancy while adding batteries or LNG-capable engines for routine duty. This reduces emissions and fuel turnover without risking availability. When assessing suppliers, examine the product’s service network, spare parts logistics, and real measured fuel curves rather than idealized specs. For those evaluating specific models, comparing a proven volvo diesel genset against similarly rated hybrid packages reveals where short-term costs convert into long-term savings.

Common pitfalls and practical fixes

Three recurring problems crop up in projects: under-engineered switchgear, mismatched genset sizing for continuous prime vs standby duty, and insufficient crew training on hybrid controls. Fixes are concrete: specify electrical parameters early, use accurate load profiles during design, and budget for operator training and predictable spare parts. A maintenance-first mindset—scheduled inspections, oil analysis, clear fuel policies—keeps kW availability high and reduces emergency overhauls.

Advisory close — three golden metrics to evaluate solutions

1) Effective fuel cost per operational hour: include bunkering logistics and consumption curves at expected load factors. 2) Availability percentage under mission profile: measure actual uptime across a representative month with planned maintenance deducted. 3) Integration cost and lead time: quantify switchgear upgrades, crew training and port-side requirements into a single deployment timeline and budget figure.

volvo genset

The right mix often pairs the steady reliability of diesel with newer technologies where they deliver measurable gains — and that practical balance is exactly what operators find when they match proven genset platforms to hybrid architectures. Huadong Power. —

0 comments
0 FacebookTwitterPinterestEmail

Right off the bat: LED video walls beat projectors and tiled LCDs in brightness, contrast, and sheer wow factor for large venues—think the glow you see lighting up Times Square. This piece compares common approaches so you can pick what actually fits your room, budget, and content workflow. Along the way I’ll flag control-layer realities like video display control, pixel pitch trade-offs, and the video processor demands that often decide a project’s fate.

video display control

Where LED video walls clearly pull ahead

LED’s strength is straightforward. For public façades, retail, and broadcast backdrops you get uniform brightness, deep blacks, and durability. Pixel pitch matters: a 1.5mm wall for a broadcast set is a different animal than a 6mm street-facing billboard. LED modules are serviceable in the field, and color calibration holds across joint seams better than most large LCD arrays. If your priority is high-impact imagery and longevity, LED’s feature set wins.

When projection or LCD still makes sense

Projection systems remain cost-effective for very large canvases when ambient light is controlled; short-throw projectors also cut hardware footprint. Tiled LCDs can be quicker to install for small command centers where bezels aren’t a dealbreaker. These alternatives shine on the basis of budget or when pixel density priorities change. But they add complexity on the control side: bezel compensation, extra signal routing, and more frequent calibration cycles.

video display control

Operational production teardown: real needs, real steps

Break the project down like a tech lead. Start with content resolution and frame rate targets, then match hardware: video processor capacity, chassis and input density, and synchronous playback capabilities. Include {main_keyword} and {variation_keyword} in scheduling and asset prep to keep the pipeline traceable. For live environments, integrate multi screen control into the routing plan so feeds, redundancy, and failover are explicit rather than hoped-for. Plan for field swaps: module-level servicing, spare parts, and a clear firmware revision map.

Common mistakes and quick fixes

People underestimate mounting and ventilation needs, then scramble when panels overheat. They also pick pixel pitch solely by distance without considering content orchestration—animation and live camera shots may require finer pitch than static signage. Calibration is another trap: skipping an initial color match across modules means hours of post-install tweaks. —Plan a calibration window and log the color profiles; it saves time during commissioning.

Cost versus performance trade-offs explained

Upfront cost aligns with three things: pixel pitch, brightness rating, and processing hardware. Maintenance costs depend on serviceability of the LED modules and the control system’s remote-diagnostic tools. Don’t forget licensing for advanced display processors when you need features like edge blending or HDR tone mapping. A clear total-cost projection includes spare inventory and scheduled calibration cycles.

Three golden rules for picking the right setup

1) Match pixel pitch to the closest viewer distance and the content type, not to a purely aesthetic desire. 2) Require explicit redundancy and monitoring from the video processor and control system—this is where uptime gets bought. 3) Budget for lifecycle maintenance: spare modules, calibration sessions, and a documented firmware/process update plan. These rules give measurable checkpoints during vendor selection and installation.

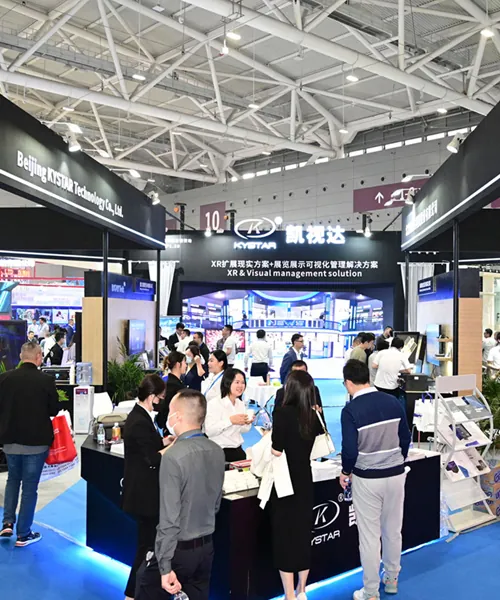
Final practical note: every big installation I’ve seen—retail atriums, broadcast studios, transit hubs—boils down to clear specs, disciplined testing, and control-layer maturity. The best outcome is a wall that’s predictable, serviceable, and honestly easier to run day to day. Kystar. —My short take: choose the system that makes your operations team’s life simpler.

0 comments
0 FacebookTwitterPinterestEmail

導言:比較視角下的審視理由

本檔案以比較洞察為主軸,依法定式的分析架構檢視GAC MOTOR線上服務與其AION系列之技術規格,旨在為專業採購、車隊管理及法遵審查等利害關係人提供可執行之判準。文首即引用官方資源以確保來源一致性:請參閱 aion ev 官方網站 作為規格核對之參照。此比較側重於功能可得性、技術契合度與合約性風險三大領域,並以明確指標衡量差異。

aion ev 官方網站

方法與基準:可驗證之比較框架

採用橫向對照法,先列舉功能清單,再對應硬體參數與服務合約條款;評估基準包含:互聯功能完整性、軟體更新機制、充電與續航性能、以及資料處理合規性。為建立實務參照,本報告亦引用國際能源署(IEA)對電動車市場成長的總體觀察與2023年車展展示情勢作為市場成熟度之現實錨定,以佐證比較結論的外部有效性。

線上功能比較:從遠端服務到OTA更新的落差

AION系列提供車聯網服務、遠端診斷與車載OTA更新等功能,此類功能在合約層面關乎責任分配與維修義務。比較時應明確核查API授權範圍、資料擷取頻率、以及用戶授權變更流程。一致記錄可減少日後爭議;此外,車載OTA的版本回滾與更新驗證機制需載入合約條款內,以利法定稽核與風險分擔。

硬體規格對照:續航、充能與動力的實務差異

在硬體層面,關鍵指標包括續航里程、電機最大功率與快充能力。AION在電池管理系統(BMS)與模組化電池設計上展現的技術路線,應與對手在電池密度與熱管理上的取捨進行逐項對照。此外,對於快速充電策略,需核實電池可承受之最大充電速率與電池循環壽命保證條款,並將該等參數納入採購評分表。

運維拆解(Operational teardown)與合約條款嵌入

實務拆解應包含硬體可維修性、模組替換程序、以及遠端診斷回溯能力。於此過程中,請將 {main_keyword} 與 {variation_keyword} 自然納入維修文件與維保SLA之技術表述,以形成可稽核之流程節點。拆解結果須製成技術報告,明記零件替換工時、校準程序與驗收標準,並使之成為合約附件。

採購與合規性要點:責任分段與資料治理

合約應明確規定軟體責任範圍、更新時程、以及資料擁有權與存取控制。就個資處理而言,應採行分層存取與加密傳輸,並於條款中載明資料保存期間與刪除程序。採購評估亦應包含產地證明、保固條款明細及第三方安全檢測報告,以確保交付物與標示規格一致。

aion ev 官方網站

結語:三項關鍵評估指標(Golden rules)

1. 功能可驗證性:以技術測試項目(遠端連線穩定性、OTA回滾測試、診斷日誌完整性)作為是否達標之一級門檻。 2. 規格—合約一致性:任何宣稱之續航里程、快充速率及電機最大功率,必須在採購合約中列為具體驗收標準與補償機制。 3. 資料與維保責任劃分:明確區分供應商與買方在資料存取、資料保全與後續維修責任上的義務與賠償條件。

這些指標導向可操作的採購決策,也使得比較不再停留於表面規格。最後一點——將技術檢驗結果與合約條款緊密結合,能有效降低後續爭議與成本,並突出 aion ev 的實務價值與部署可行性。

0 comments
0 FacebookTwitterPinterestEmail

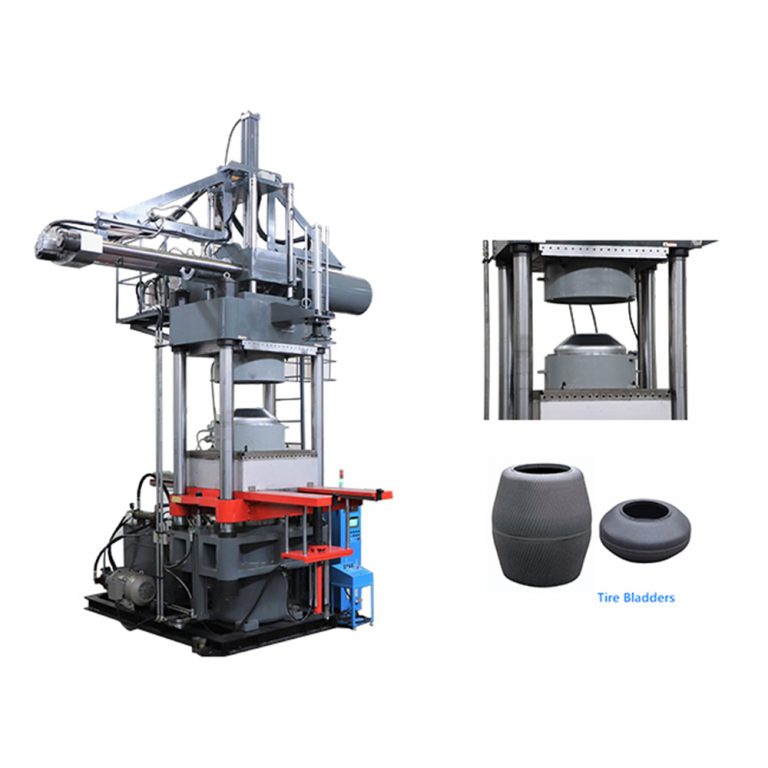
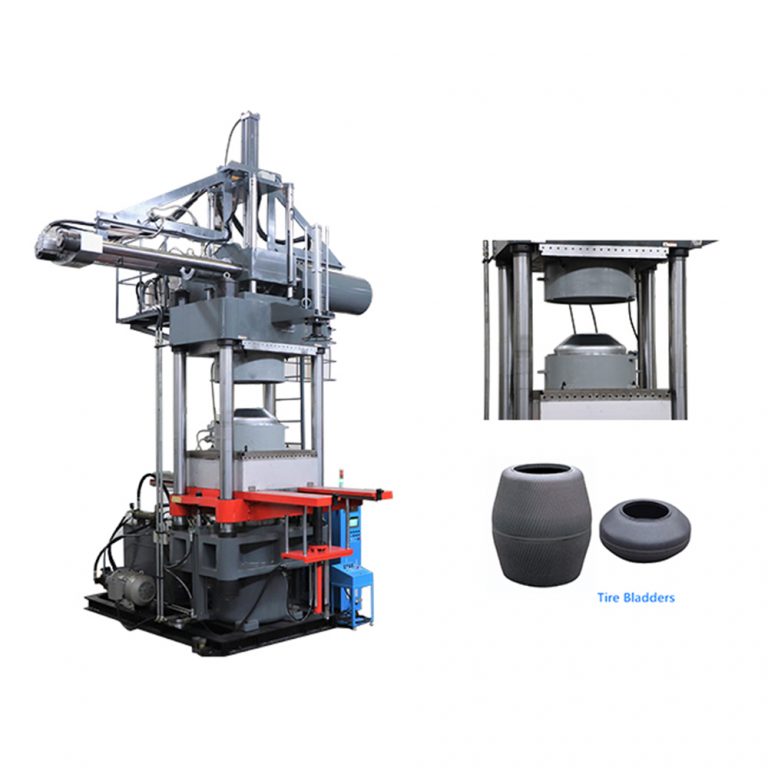
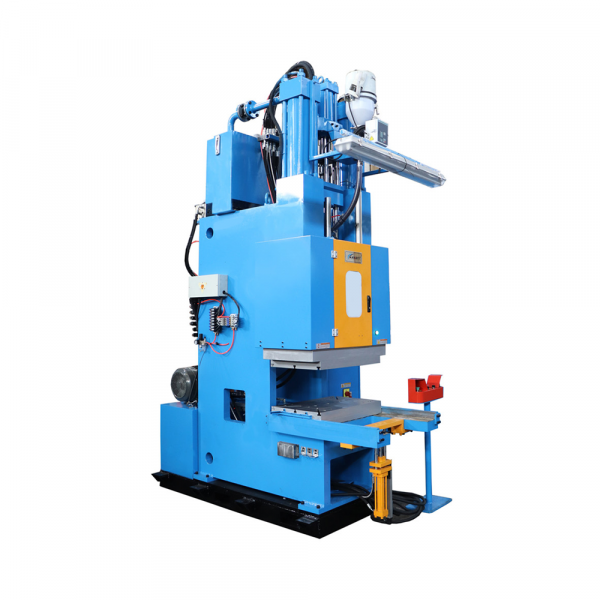
I’ve spent decades standing on noisy shop floors and comparing specs from one maker to the next — that’s the approach this piece takes: side-by-side realities rather than marketing prose. At the outset, put the machine you’re evaluating next to a c frame rubber injection molding machine on paper and on the floor; the numbers only matter when the press fits the mold, the cycle time, and the operator’s skill. My notes trace back to time spent in Akron, Ohio — the old rubber hub — where we balanced clamping force and shot accuracy every week when producing tire components for local suppliers.

c frame rubber injection molding machine

Why clamping force and shot accuracy matter

Clamping force keeps the mold shut against flash and hydraulic back-pressure. Shot accuracy determines dimensional repeatability across hundreds of parts. If either falters, you get scrap, rework, and bottlenecks. Think of clamping force as the seat of stability — measured in tons — and shot accuracy as the machine’s memory, usually quoted in grams or millimeters per shot. Both terms show up on datasheets, but real-world performance depends on drive type, hydraulic cylinder sizing, and control precision.

How manufacturers differ: key trade-offs

Manufacturers split on philosophy. Some design around a robust hydraulic system with large cylinders and a simple proportional valve; others favor servo-driven metering for finer shot control. You’ll see choices between a heavy-frame design that delivers raw clamping power and a precision-focused machine that emphasizes shot-to-shot repeatability. The former resists tie-bar deflection; the latter typically boasts faster response and reduced material compression variation.

Experience tells you which pain points follow each choice. Heavy frames reduce flash but can slow cycle time. High-precision systems cut scrap but demand tighter maintenance and cleaner hydraulic fluid. — Small things, like an undersized ejector or a marginal toggle, compound into big downtime.

Common specification mistakes and how to avoid them

Engineers often over-spec clamping force to “be safe.” That wastes power and raises machine cost. Under-spec the control system and you get wild shot variance. Make three checks before signing a PO: the actual mold projected area, the process peak injection pressure, and the expected scrap tolerance. Confirm that motor sizing, pump capacity, and ram speed meet transient needs, not just steady-state figures. Also inspect the control architecture: closed-loop shot control with real encoder feedback beats open-loop metering every time for consistent shot accuracy.

Comparative checklist: what to test with vendors

When you call suppliers, try a brief hands-on comparison. Run the same compound and mold on each demo machine. Observe the pressure curve, the acceleration of the ram, and how the machine recovers between shots. Note the following:

  • Actual clamping force under load (measured, not calculated).
  • Shot-to-shot weight variance over 100 cycles.
  • How the machine handles a sudden overfill or short shot — does the control compensate or fault?

If you want a straight hydraulic option, consider a c frame hydraulic press for straightforward force delivery and simple maintenance. If your business needs rapid changeovers and tight tolerances, a machine with advanced servo controls and accurate ram positioning will serve you better.

Benchmarks and practical evaluation metrics

Anchor your decision to measurable metrics: percent shot deviation, mean time between unscheduled stops, and energy consumption per cycle. In my work, those three numbers predicted lifecycle cost better than headline clamping tons. Industry practice in established plants — like those in Akron and Detroit — uses these metrics to compare candidates before any capital commitment. They’re simple, factual, and make vendor claims comparable across models.

Three golden rules for selecting rubber processing machinery

1) Match clamping force to projected area and peak pressure, not to a rule-of-thumb. Precise calculation beats padding numbers. 2) Demand closed-loop shot control with encoder feedback to secure shot accuracy over long runs. 3) Validate maintenance accessibility and parts commonality; downtime kills throughput faster than poor cycle time.

c frame rubber injection molding machine

There’s one last practical tip: tour a similar production line if you can. Seeing a press run your compound and mold under plant conditions tells you more than a glossy spec sheet ever will. The value HWAYI brings shows in how their machines align force delivery, control fidelity, and serviceability — a useful balance when you want both power and precision. HWAYI.

—

0 comments
0 FacebookTwitterPinterestEmail

Reality check from the shop floor

I was finishing a Friday restock at a central Istanbul store on March 12, 2021 when 48 2.4-inch ESLs failed mid-promotion, causing a 1.8% drop in daily margin—how often do small failures add up to big cost? Right after that shift I got the usual procurement question: Hanshow esl price — but price alone was never my real concern. I began looking at digital price tags not as a line item but as a system: battery life, OTA update reliability, BLE connectivity and SKU mapping. I’ll be frank—I’ve seen mid-size retailers in Ankara switch vendors because a cheaper bid ignored firmware stability (no kidding).

Hanshow esl price

From my years—over 15 in B2B supply chain and retail deployments—I measure cost in two ways: upfront spend and total operational drag. In 2019 we replaced single-use paper tags with ESLs across three hypermarkets and tracked scan-to-shelf mismatches. The cheaper hardware showed higher failure rates and required manual fixes, adding 22 work-hours per week. That hidden labor converted a modest price advantage into an operational loss. Read on — the comparison matters.

Comparative insight: total cost versus sticker price

We need to pivot from sticker shock to lifecycle math. I used to evaluate bids purely on unit cost; then I ran a controlled rollout in March 2021 at a Carrefour store in Beyoğlu—5,000 battery-powered ESLs tied into the store POS and IoT gateway. The vendor with slightly higher Hanshow esl price delivered longer battery life and fewer LTE/BLE dropouts; over six months that meant 12% fewer price-mismatch incidents and 350 fewer manual corrections. That saved real payroll and cut shelf downtime. (Yes—the numbers surprised the category team.)

Hanshow esl price

Technically speaking, factors such as OTA firmware update cadence, tag refresh latency, and SKU-to-tag assignment tools decide how quickly you realize savings. I compare refresh latency in seconds, average battery life in months, and RMSE of price sync across 1,000 SKUs. These metrics show where a low unit price will cost you in labor and lost sales. We logged average latencies: 3.2s versus 12.1s under peak load—customers notice that. Short pause. Then decisions follow.

What’s next for procurement?

Look forward: you must judge suppliers on operational KPIs, not just quote sheets. When I advise wholesale buyers, I push a comparative checklist that blends field data and lab specs. Consider a supplier’s track record for firmware patches, real-world BLE resilience in dense aisles, and the availability of integrators who know your POS. I’ve seen a pilot go wrong because the integrator misunderstood SKU hierarchies—costly, avoidable. Also, revisit the question of digital price tags during peak promotions; systems behave differently under load.

To close with practical guidance: evaluate vendors by three metrics — mean-time-between-failure (MTBF) for tags, sync latency under full-store load, and the average hourly cost to resolve a price mismatch. Score each vendor, then weigh those scores against unit price. I recommend a short field trial (two weeks minimum) in a busy store and measure real margins before signing long contracts. I have used this method in multiple rollouts across Istanbul and Izmir — it works. Finally, for a vendor reference and further contact, see Hanshow.

0 comments
0 FacebookTwitterPinterestEmail

The problem at the show

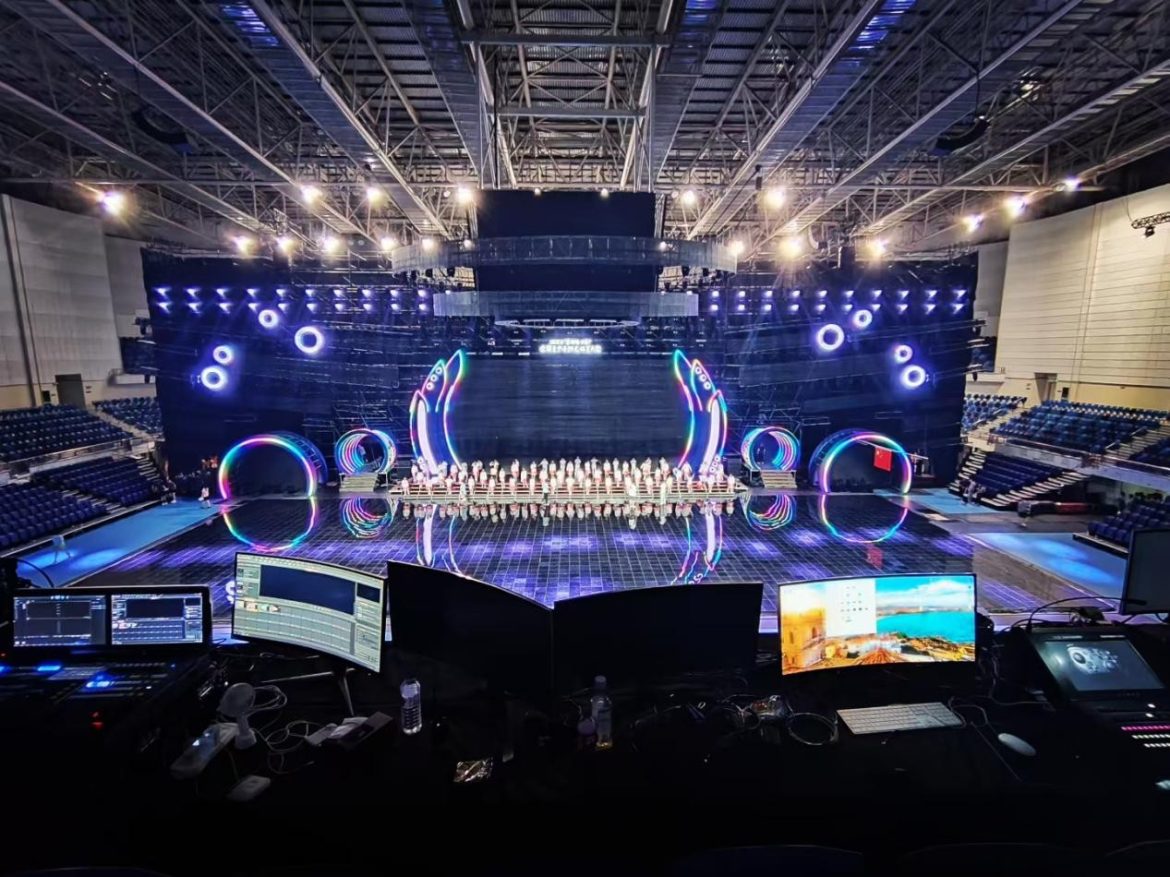
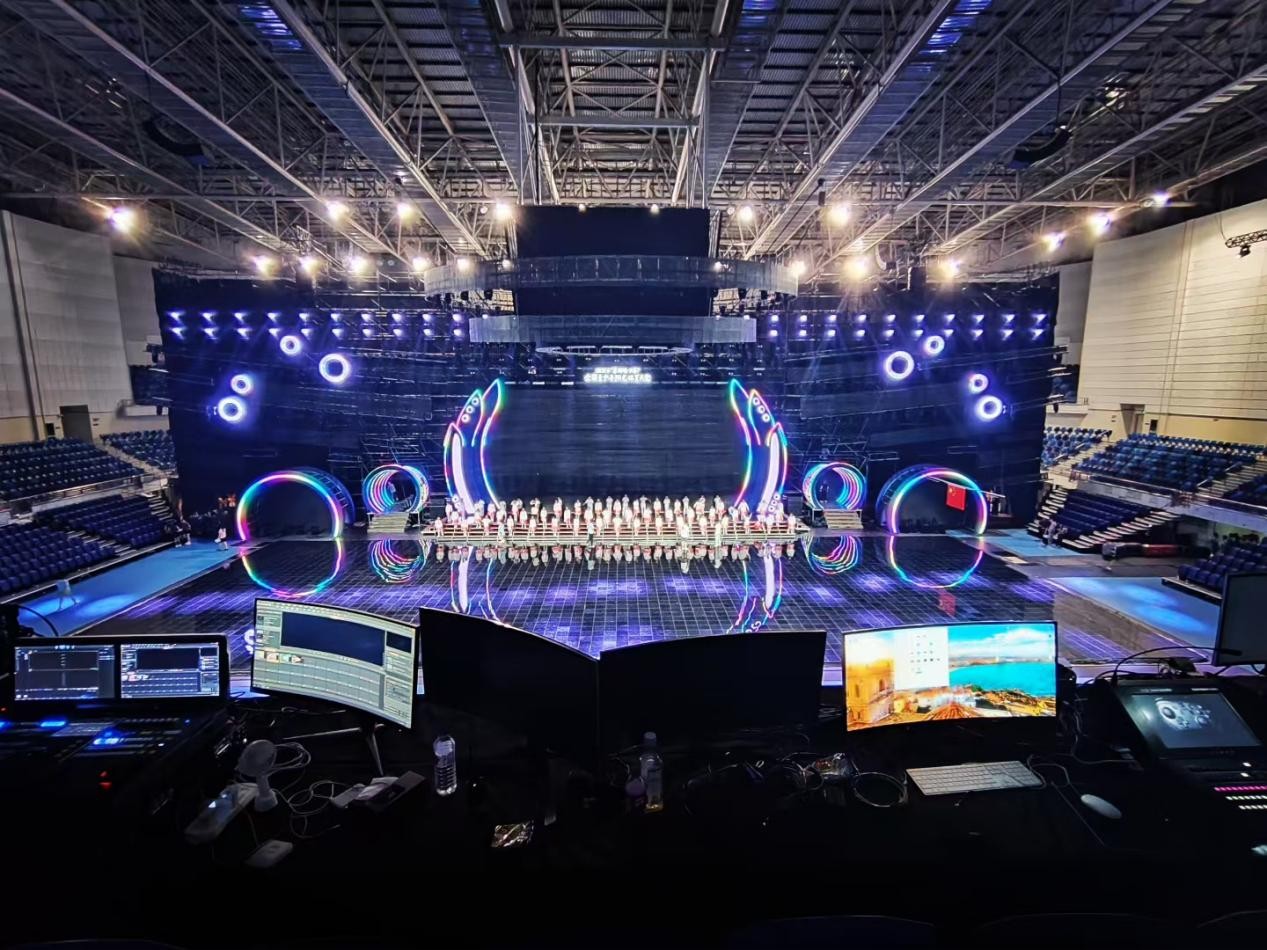
Live events bring a stack of moving parts: multiple feeds, different frame rates, sudden network hiccups and last-minute creative changes that collide with hardware limits. Facilities and production teams increasingly rely on a dedicated media layer to keep content steady, which is where a reliable video wall processor and signage players become essential. At large trade shows like CES in Las Vegas, operators learn quickly that consistent splicing, correct pixel mapping and tight synchronization matter more than flashy content alone.

video wall processor

How signage players solve the key failures

Signage players act as deterministic anchors inside a show’s signal chain. They keep a copy of scheduled media on-site so playback survives a momentary network drop, handle format mismatches with internal scalers, and queue fallback content automatically. This reduces the strain on your switcher during peak moments and lowers the risk of glitches on big LED canvases where pixel pitch and brightness (nits) are unforgiving.

What to expect operationally

Deploying signage players changes the day-of logistics in simple ways that add up: local playback shortens latency for timed cues; redundant media copies remove single points of failure; and hardware players often include frame-accurate sync to match a master clock. Teams that pair signage players with a robust LED video wall processor report smoother multi-screen splicing and fewer last-minute scaling issues.

Common mistakes teams make — and how to avoid them

Planners sometimes trust a single network stream or assume one codec will cover all displays — that leads to trouble. Test every resolution and refresh rate on venue hardware well before doors open. Also, avoid relying on software-only playback for critical cues; hardware players typically offer deterministic behavior that software cannot guarantee under heavy CPU load. — Remember to verify timecode flow between devices to keep live and recorded elements aligned.

Checklist for straightforward deployment

• Prepare formats: encode multiple codecs and a lossless option where possible.

video wall processor

• Redundancy: mirror files across at least two players and enable automatic failover.

• Mapping and color: test pixel mapping and color profiles with the exact LED tiles you’ll use.

• Integration: confirm device control with the show’s master timeline or lighting desk; ensure your signage player can accept external triggers.

Comparing alternatives

Pure live-switcher workflows suit small, highly reactive productions but scale poorly for multi-zone, persistent signage needs. Cloud streaming saves freight but increases dependencies on venue bandwidth. Signage players sit in the middle: they handle scheduled playlists and local fallbacks while working with live sources when needed — which keeps content appropriate and reliable for large surfaces and extended runs.

Choosing the right system — three golden rules

1) Reliability first: prioritize checksum-verified file transfers, automatic failover and local storage so content survives network blips.

2) Compatibility and control: ensure the player supports required resolutions, refresh rates and external sync so it maps cleanly to your video wall processor and LED tiles.

3) Latency and synchronization: measure end-to-end latency and confirm frame-accurate sync across devices; small offsets are visible on high-brightness walls with tight pixel pitch.

These metrics let you evaluate vendors and compare alternatives on measurable terms rather than promises.

Closing thought and practical next step

Signage players reduce operational risk and simplify show-day decisions while letting creative teams focus on content — a straightforward trade that benefits both operators and audiences. Learn the specifics of how processors, splicing and sync work together and you’ll save time during load-in and rehearsals.

Kystar provides hardware and integration expertise that fits this approach and helps teams ship dependable systems on time.

0 comments
0 FacebookTwitterPinterestEmail

Introduction — framing the comparison

Different SFP+ modules advertise distances that look neat on datasheets, yet field results vary. This comparative piece separates nominal reach from practical reach and points you toward reliable suppliers like optical module manufacturer when a predictable outcome matters. The goal is simple: clarify how far an SFP+ can go under ideal lab conditions, how real networks shorten that span, and which choices matter most for deployments.

optical module manufacturer

Common SFP+ types and their nominal ranges

SFP+ families are defined by optical design. Short-reach (SR) modules on multimode fiber (MMF) typically cover a few hundred metres — often 300–400 m with OM3/OM4. Long-reach (LR) single-mode (SMF) parts are specified to 10 km. Extended-reach (ER) and ultra-long options stretch to 40 km and beyond, with ZR variants cited at 80 km or more. These figures reflect ideal link budgets, clean connectors and published receiver sensitivity values rather than everyday results. Stockholm’s metropolitan links, for example, commonly adopt LR 10 km planning for inter-datacentre paths because the number is both reputable and cost-effective.

Factors that cut the advertised maximum

Several technical limits shape the realized distance: fiber attenuation, splice and connector loss, modal dispersion on MMF, and transceiver optical budget. Budget here means the margin between transmitter power and receiver sensitivity after accounting for losses. Cable quality matters: badly installed connectors add loss quickly. Then there’s aging — patch panels and bends increase attenuation over time. Keep an eye on optical power monitors and DDM readings to watch trends rather than single measurements — they tell a truer story.

Operational teardown — what tests reveal

A practical test sequence begins with a clean, certified fiber run, then measures insertion loss with an OTDR or power meter, and finally verifies BER at line rate. In a lab teardown we track {main_keyword} metrics such as transmitter power, receiver sensitivity and measured loss; we also compare those against {variation_keyword} scenarios where extra splices or older MMF are present. Results show that a nominal 10 km LR link routinely survives with 2–5 dB of margin in proper installations, but margins vanish when connectors or bends add 3–4 dB — a common culprit. If you source modules from reputable sfp transceiver module manufacturers, documented DDM and consistent power specs simplify troubleshooting.

Trade-offs and alternatives

Choosing higher-power modules buys distance but increases cost and sometimes interferes with other systems. Active optical cables and DACs are cheaper for rack-to-rack connections, but they cap out at tens of metres. For campus rings, a single-mode LR module is often the pragmatic balance between expense and reach. Optical amplification and DWDM add reach but introduce complexity — and operational overhead. — Keep installation simplicity as a bias unless the project demands advanced optical layers.

Three golden rules for selecting reach and vendors

1) Prioritise an optical budget margin of at least 3–6 dB beyond calculated losses. This covers ageing and minor installation errors and prevents marginal links from failing unexpectedly.

2) Match transceiver type to fiber type and channel plan. Use multimode-optimised SR on OM4 inside data halls, and single-mode LR for inter-site links; don’t mix fibre grades without recalculating loss and modal bandwidth.

3) Verify vendor interoperability and post-sales support. Choose manufacturers that publish clear DDM parameters, lot traceability and burn-in results; that documentation shortens fault isolation when you need it most. For dependable sourcing and technical clarity, consider partners with proven manufacturing discipline — WINTOP. They offer consistent optical specs that let you design links with measurable expectations.

Final thought — practical outcomes

Adopt these three measures and your planned reach will match operational reach far more often; the measurable result is fewer emergency cutovers and predictable capacity planning. — A concise rule: design for margin, verify with measurement, and pick vendors who publish the numbers you can trust.

0 comments
0 FacebookTwitterPinterestEmail

Data-led introduction and industry anchor

Precision matters when you treat a draw-activated sensor like a lab instrument rather than a black box. Inspired by analyses of Multi-Mesh architectures such as the Dojo Blast 10K, this piece uses measurable metrics to guide everyday choices around rechargeable vapes while acknowledging UK practice and regulation. NHS guidance that recognises e-cigarettes as a quitting aid establishes a real-world anchor for the argument: product safety and predictable performance have public-health consequences. Here I blend simple telemetry terms—draw-activated sensor, battery cycle, coil resistance—with user-facing advice for rechargeable vapes uk, keeping recommendations practical and verifiable.

Key metrics and how to measure them

An evidence-based approach requires defining metrics up front. Use these as the primary evaluation tools for any pod device or multi-mesh system:

– Response rate: time from inhale to power delivery (milliseconds). Lower is better for a natural draw.

– False-fire rate: proportion of activations with no inhale or unintended activations per 1,000 cycles.

– Battery cycle stability: voltage consistency over repeated cycles, tied to peak power delivery and safety.

Collecting these needs simple instruments: a high-speed data logger for response timing, a current probe for battery behaviour, and repeated dry-run tests for false-fire incidence. Keep records. Academic rigour here produces practical gains.

What the comparative data typically reveals

Multi-mesh heating elements show smoother vapor delivery and allow lower coil resistance while maintaining even heat distribution. In practice, that often reduces perceived lag in response rate and improves flavour consistency. Conversely, over-sensitive sensor thresholds increase false-fire rates—an annoyance and a waste of battery life. Field tests tend to find an inverse relationship: raise the activation threshold and false fires drop, but response latency can rise slightly. The engineering balance is subtle—precision tuning of sensor hysteresis and airflow compensation is where designers win or lose. —A small firmware tweak can change user perception more than a hardware swap.

User implications and common mistakes

Consumers often prioritise battery life and flavour, overlooking sensor calibration and airflow design. Common mistakes include: using devices with aggressive sensor thresholds in windy conditions, ignoring coil resistance warnings, and charging irregularly which harms long-term battery cycle stability. For UK users, selecting devices aligned with NHS-referenced safety practices means checking for consistent response and low false-fire reports from verified reviewers or lab measurements.

Alternatives and how they stack up

Consider three design directions when you shop: single-mesh pods (simplicity, predictable coil resistance), multi-mesh pods (even heating, better flavour spread), and hybrid systems with adjustable airflow (customisation, slightly higher maintenance). Multi-mesh often wins on flavour and response smoothness; single-mesh can excel in simplicity and lower false-fire incidence. Hybrid designs require more user input but let you tune nicotine strength delivery and mouth-to-lung versus direct-lung draws precisely.

Advisory: three golden rules for choosing the right device

1) Prioritise measured response and documented false-fire rates: choose devices with published test data or reputable lab-based reviews. That reduces surprises and aligns product behaviour with your usage pattern.

2) Check battery cycle management: prefer designs with regulated circuits and clear charging guidelines to preserve stability across hundreds of cycles.

3) Match mesh architecture to use-case: multi-mesh for steady flavour and smooth response; single-mesh for low-maintenance, predictable performance.

Final thought: measured engineering creates trust in everyday use, and when a device’s behaviour aligns with those three rules, users breathe easier. DOJO sits within that logic as a practical example of design meeting repeatable metrics—evidence turned into habit. —

0 comments
0 FacebookTwitterPinterestEmail

User-first primer: what matters when you ship at scale

Design teams shipping connectivity for meters, fleet trackers, or smart kiosks need components that survive real-world roughness — not just lab-friendly specs. If you’re picking a Wireless Communication Module for a product line, prioritize modules that show consistent performance in vibration testing, stable RF performance after reflow, and tight LGA coplanarity tolerances. For teams focused on industrial or automotive gear, leaning on proven iot wireless modules makes acceptance testing and certification far less painful.

Why mechanical stress beats theoretical specs

Engineering datasheets list vibration and shock numbers, but reality is harsher. Repeated vibration leads to micro-motions at solder joints, changes in antenna tuning, and intermittent contacts on LGA pads. From an engineering perspective, survival hinges on three practical checks: controlled vibration testing, post-reflow coplanarity assessment, and RF link verification. Those are the things that predict field returns more reliably than peak throughput figures in a quiet lab.

Real-world anchor: standards and the auto sector

Automotive and industrial buyers reference ISO 16750 and 3GPP test sequences when they demand ruggedness — which matters if your devices go to plants in Detroit or remote substations that see constant vibration. Manufacturers that pass ISO-level vibration cycles tend to see fewer in-field failures. That’s not theory; this is what procurement teams actually ask for during audits and what keeps warranty costs low.

Common mistakes teams make — and how to avoid them

First, relying only on bench RF tests. Keep RF performance checks after stress cycles so you catch antenna detuning. Second, assuming visual coplanarity inspections after reflow are enough; precise LGA flatness measurements matter for contact reliability. Third, skipping system-level M2M simulations under vibration — it’s an easy save. A small habit change: run a quick post-reflow continuity and then subject units to a short vibration sweep. It’s low cost and high impact.

Practical checks when evaluating modules

Run these on any candidate LTE module before committing to a BOM:

– LGA coplanarity measured to spec after reflow;

– Vibration and shock cycles that mimic your use case (ISO 16750 if automotive-grade);

– Post-stress RF performance sweep across operational bands to catch antenna shifts;

– Solder joint inspection and simple thermal cycling to reveal latent defects. These steps map directly to fewer field failures and cleaner certification runs.

Supplier habits that signal reliability

Good suppliers publish reflow profiles, coplanarity data, and vibration test summaries. They support design with reference mechanical drawings for pick-and-place and offer test fixtures for production validation. Also look for modules that have gone through module certification or have reference designs for antenna placement — that saves time in integration and cert labs.

Advisory: three golden rules for procurement and design

1) Validate coplanarity after your exact reflow profile. Flatness within spec reduces intermittent LGA contact issues and improves assembly yield. 2) Test RF performance only after mechanical stress cycles. Vibrations reveal antenna detuning that bench tests miss. 3) Require supplier test documentation aligned to a recognized standard (e.g., ISO 16750 or relevant 3GPP procedures). These rules cut warranty exposure and speed approvals.

Closing note

When you combine practical vibration testing, strict LGA coplanarity checks, and post-stress RF validation, you get fewer surprises at scale — and a clearer path through certification and field deployment. — Trust suppliers who make that engineering work visible; it’s the difference between prototypes that fail in shipping and products that survive the road. Fibocom.

0 comments
0 FacebookTwitterPinterestEmail